This page shows current Alerts for Blow-Up Fire Event potential.ISSUE DATE:
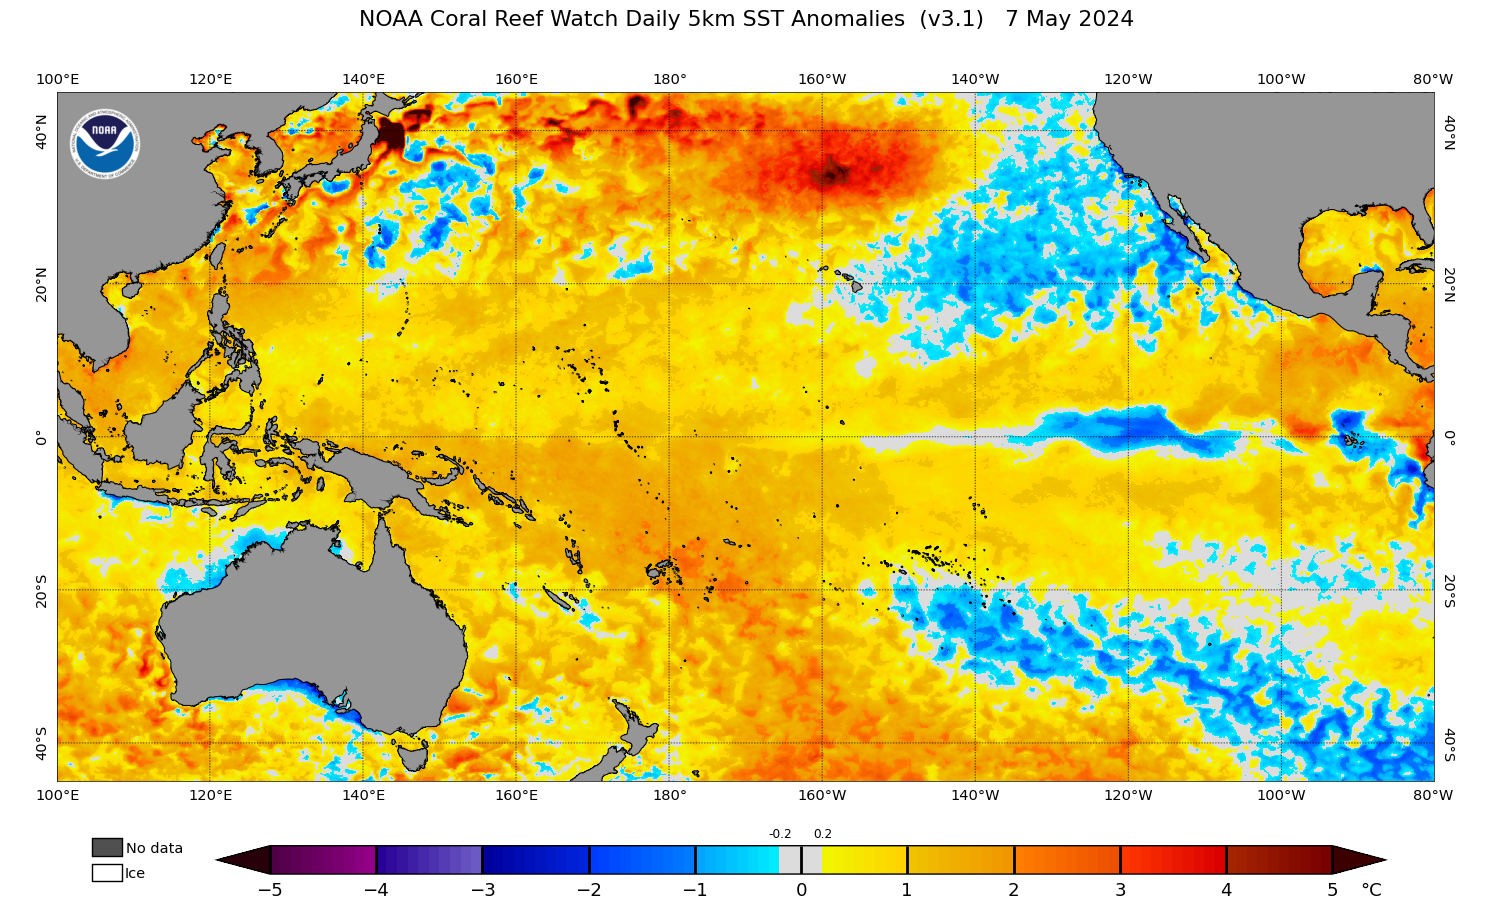
This is an Operational Tool. | Current daily SSTA charts (NOAA Coral Reef Watch) Click maps to see at full size on NOAA site. 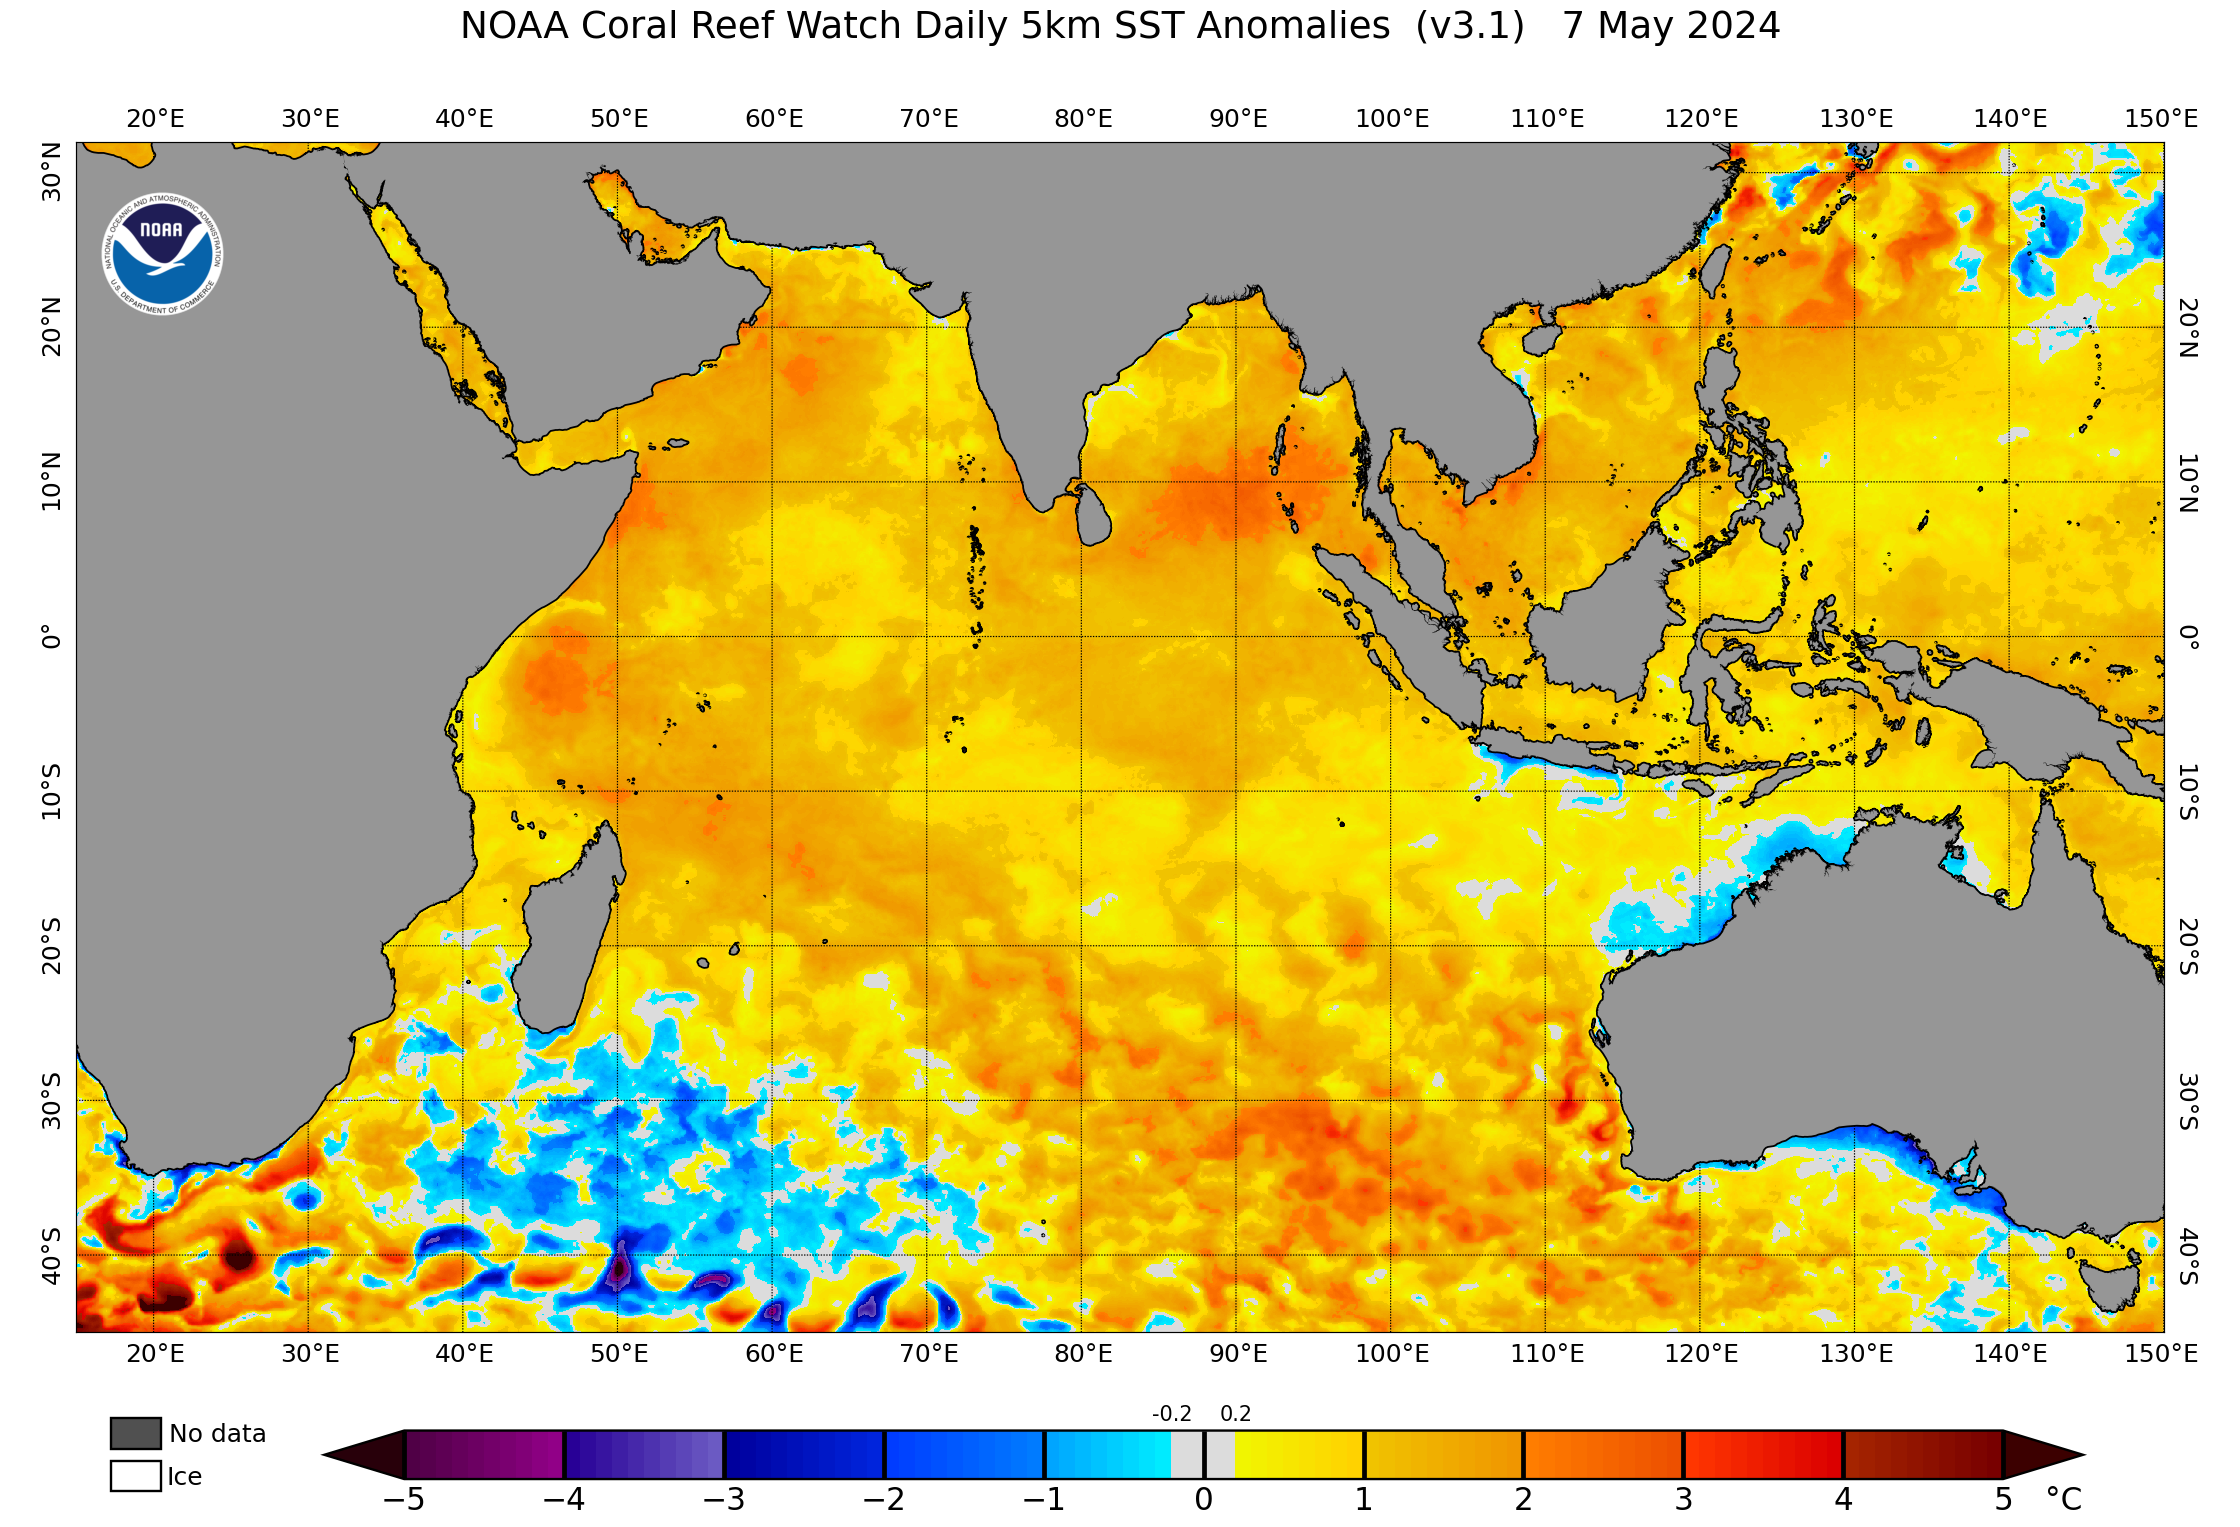
|
LEVEL 1 | Current Alert Status:  NO ALERT. [Click on image to enlarge.] ANALYSIS:A reminder is in place. Even though elevated fire danger is less likely, significantly raised SSTAs and LTAs suggest care is need with fire management going into Winter. (It is worth noting that the Los Angleles fires were due to isentropic drawdown in Winter.) The recent prolonged sequence of Level 2 Alerts indicates that a key drought process is in play in the west of the area and may persist through the coming months. This must be monitored. | ||
LEVEL 2 | Current Alert Status: NO ALERT.ANALYSIS: We have entered Winter, so are less likely to see elevated fire danger. However there are dry and nearly dry rivers in place. So care is needed with fire west of the Great Divide. One key lesson from the recent Los Angeles Fires is that out-of-season blow-up fire events must be planned for.  | ||
LEVEL 3
|
It is recommended that FBANs and other technical specialists learn more about BUFEs. Operations at Level 3 require use of the BUFO2 model to assess the potential for a BUFE during an on-going fire. This requires a series of data feeds specified in the model. It is suggested that FBANs should skill-up on using the BUFO2 model.
Click here for the BUFO2 worksheet.Click here for a PowerPoint presentation on BUFO2, from a workshop at the AFAC21 Conference.Could anyone using the spreadsheet during the HPF trail please copy their results to us. | ||
| Page prepared by: Adjunct Professor Rick McRae UNSW Canberra School of Science Bushfire Research Group r.mcrae@unsw.edu.au |
BASISThis work is based on both analyses of data from Black Summer and operational work. The structure of the four-tier Hierarchical Prediction System is designed to progress into smaller-scales of timeframe and function, shifting from seasonal outlook to incident operations: | ||
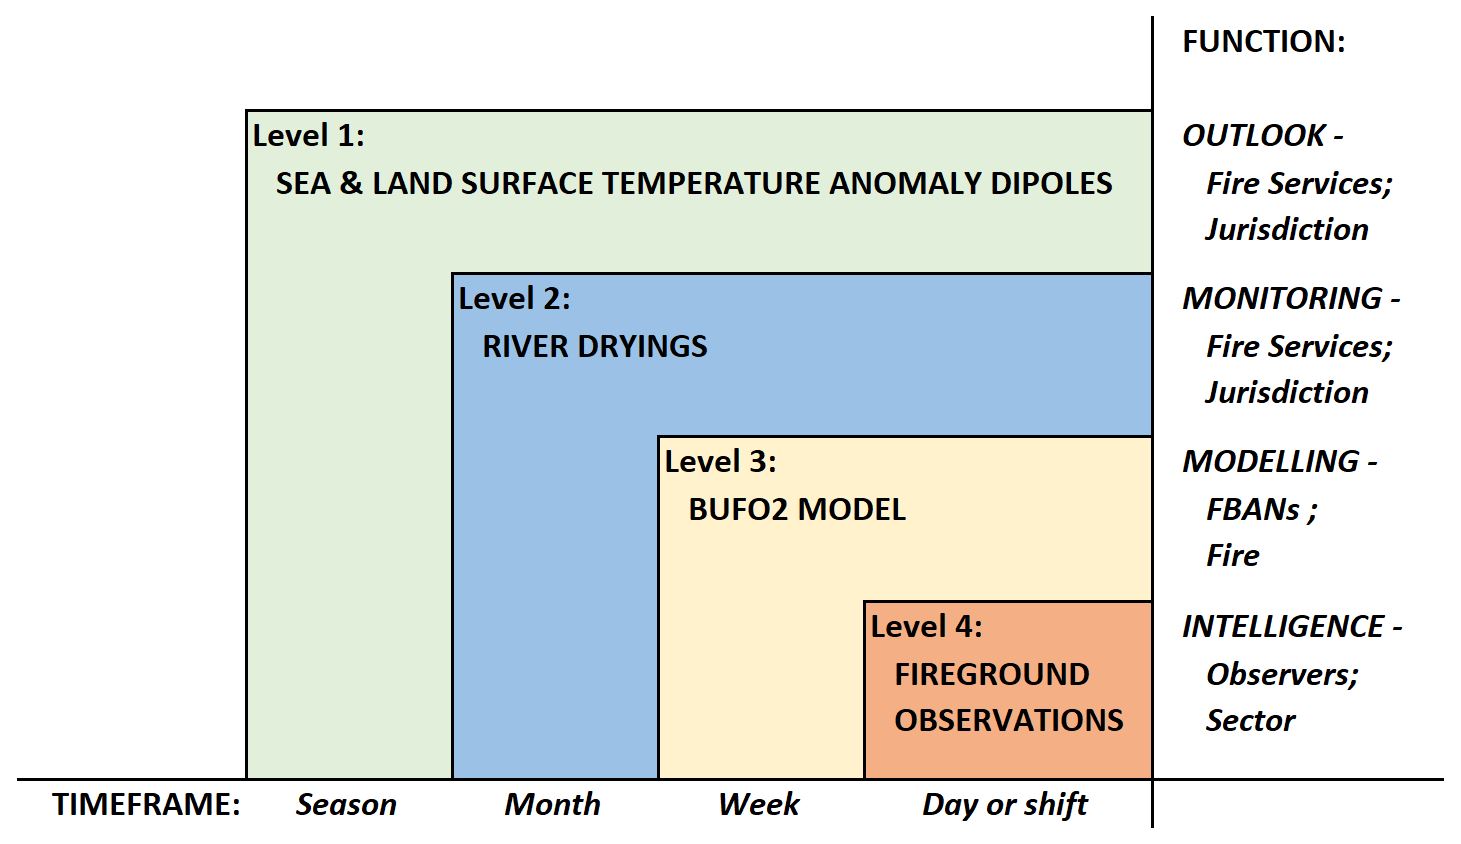 HPF is described in a peer-reviewed paper in the October 2023 edition of the Australian Journal of Emergency Management. A follow-up paper reports on HPF performance in the following year. |
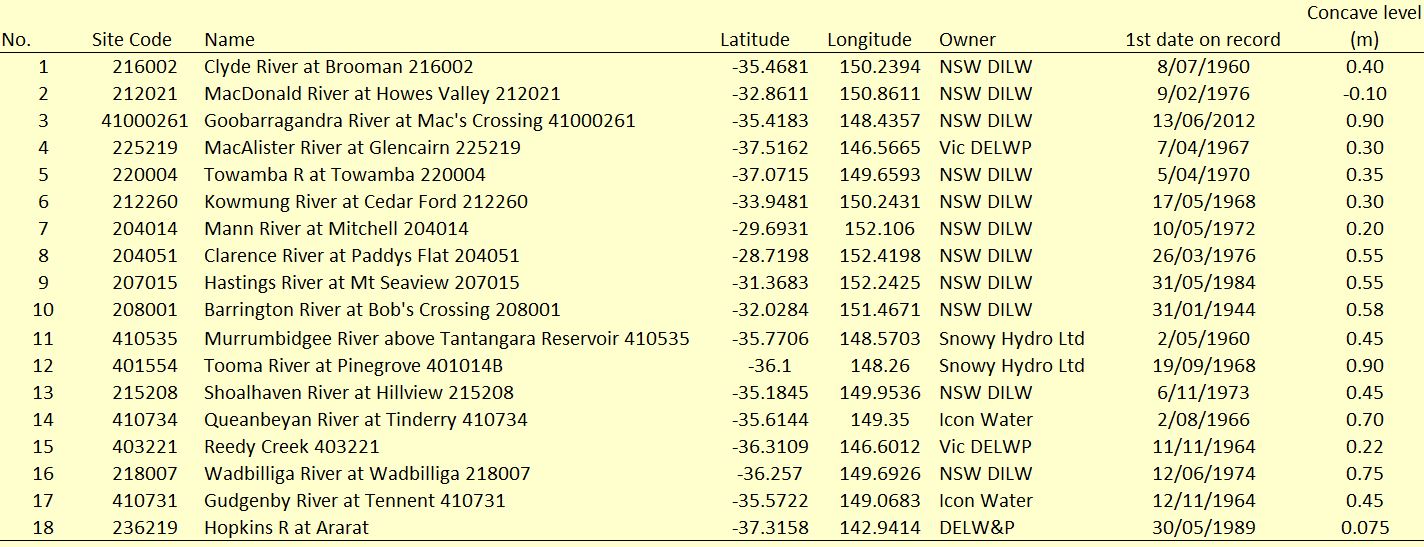
LEVEL 2 SOURCE DATAThe table and map below describe the stream flow reference sites used. | ||

| ||
| . | |
|
| 1. Clyde R at Brooman (site ID 216002) Min. level = 0.40 m. | 
| ||
|
2. Macdonald R at Howes Valley (site ID 212021) Min. level = -0.10 m. This site has questionable data - the river is notorious for silting up after major wildfires. | 
| ||
|
3. Goobarragandra R at Macs Crossing (site ID 41000261) Min. level = 0.90 m. | 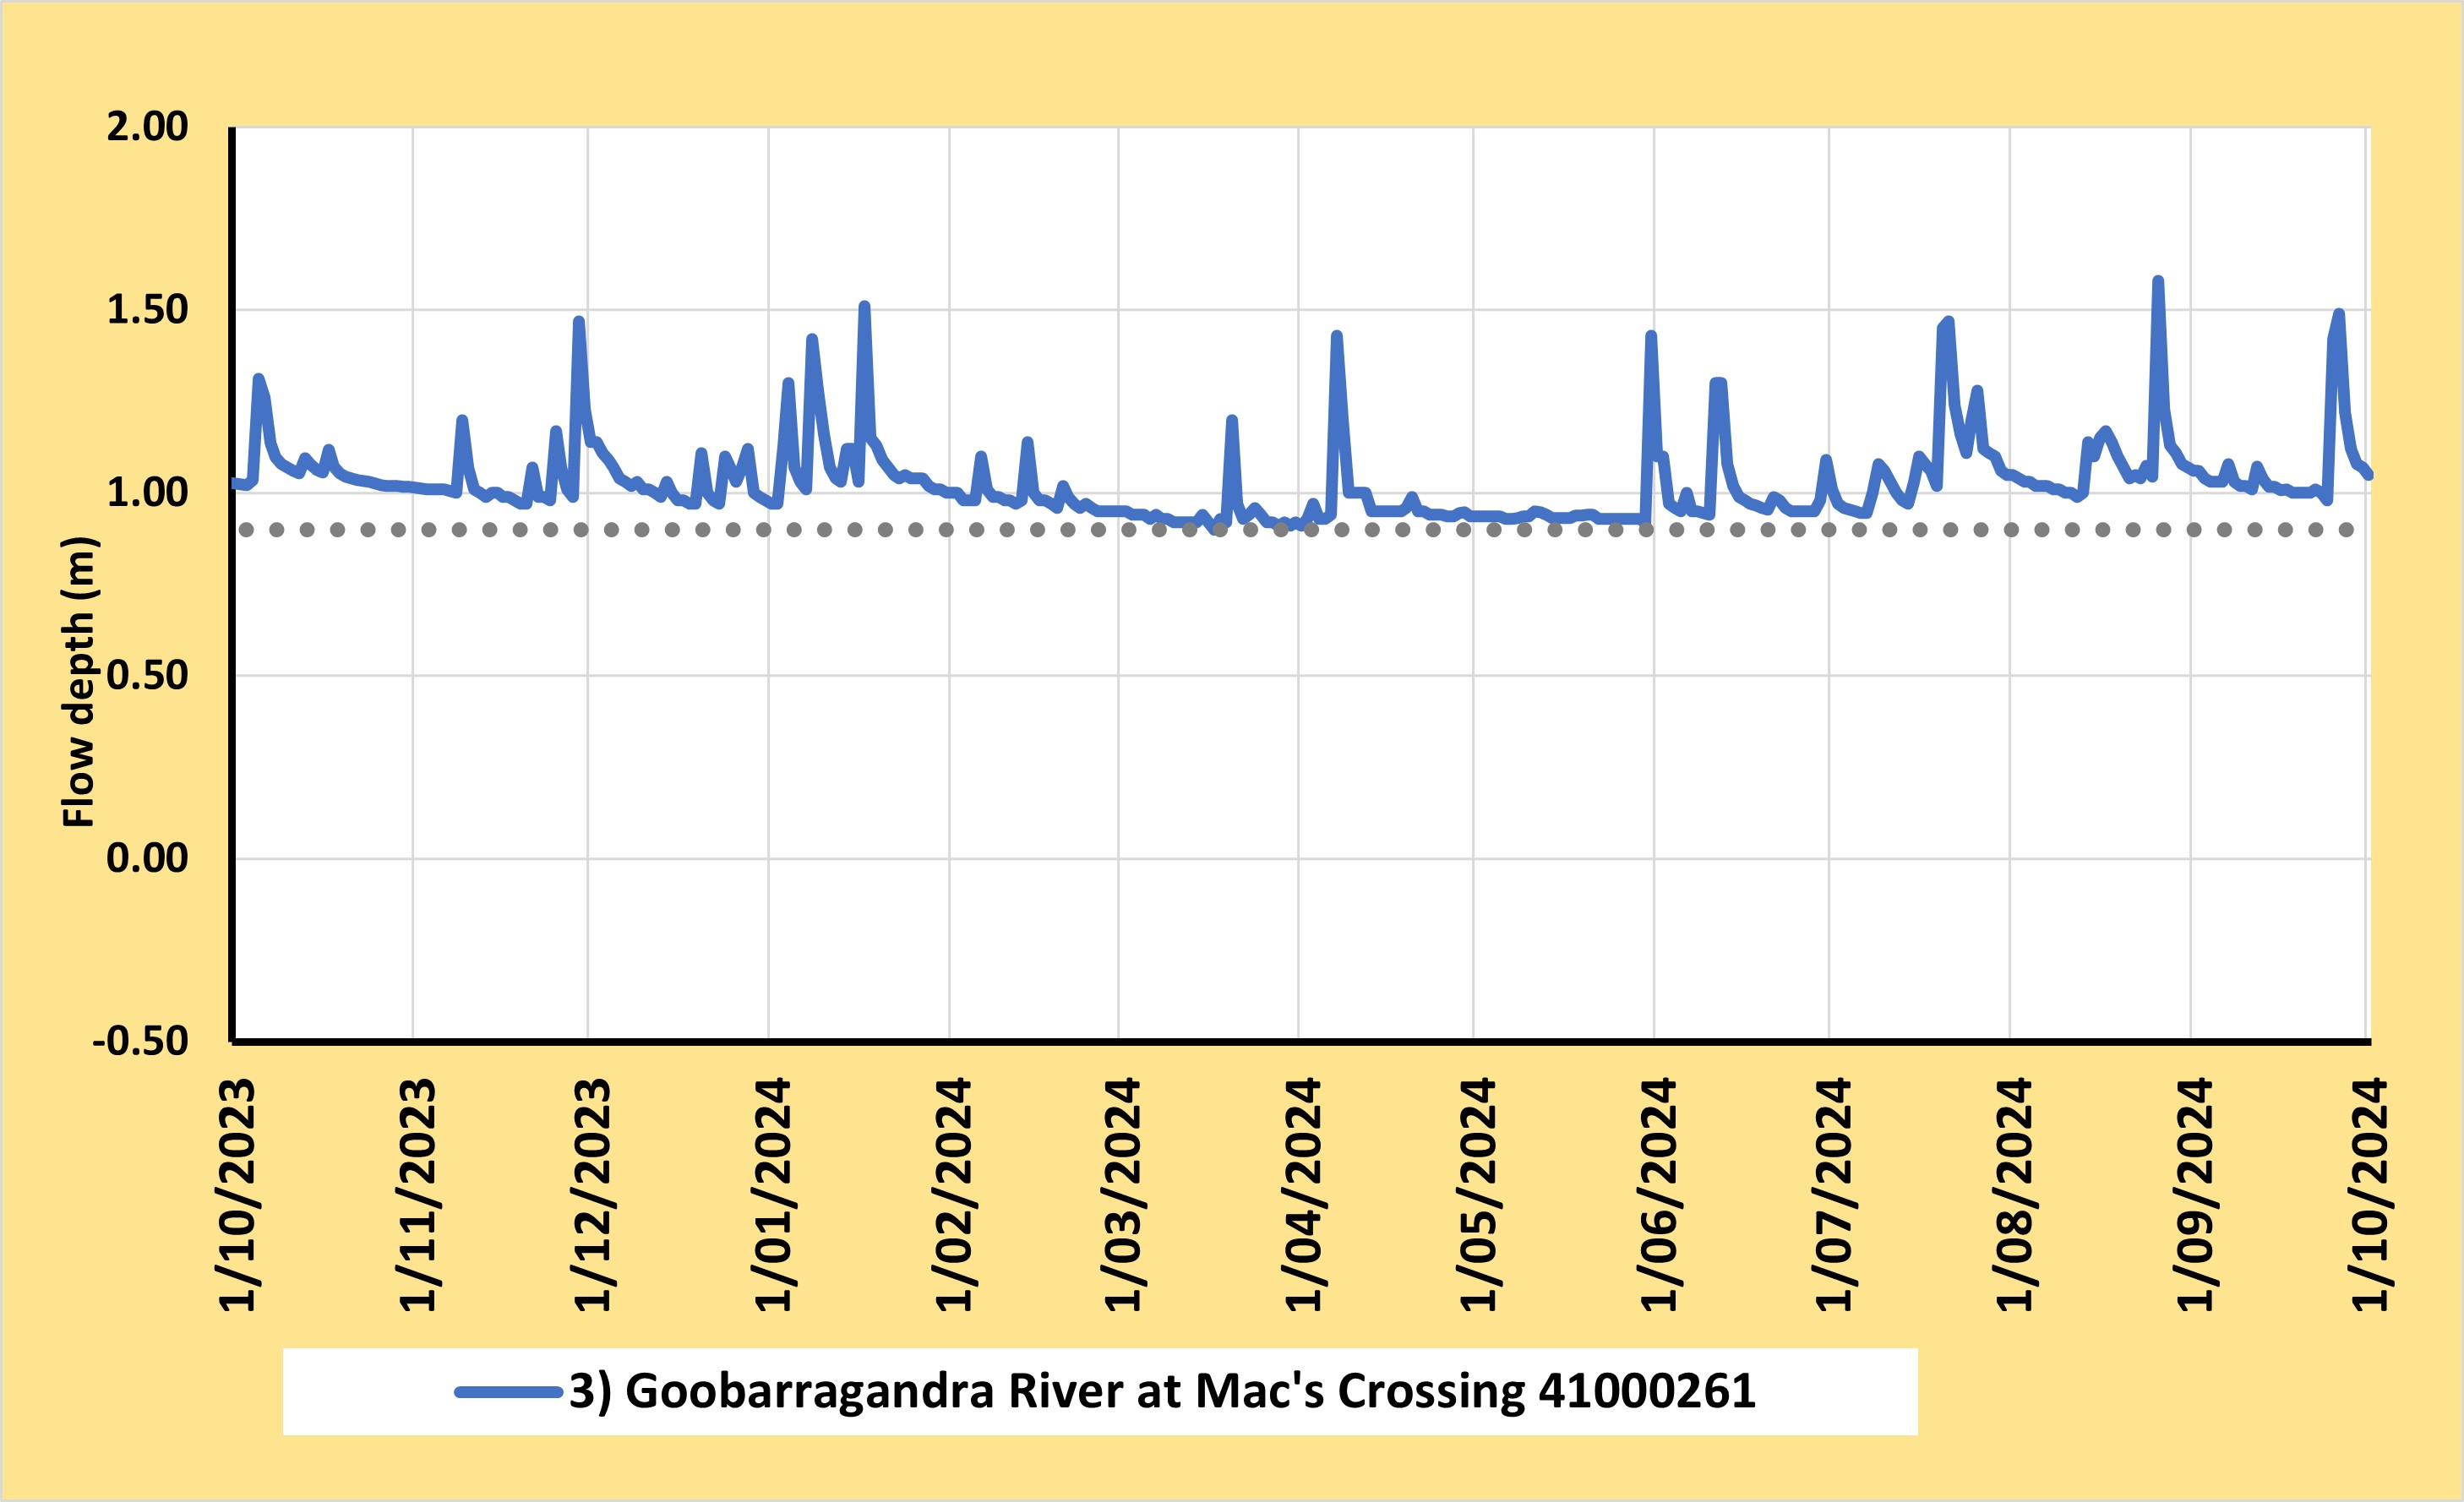
| ||
|
4. Macalister R at Glencairn (site ID 225219) Min. level = 0.30 m. | 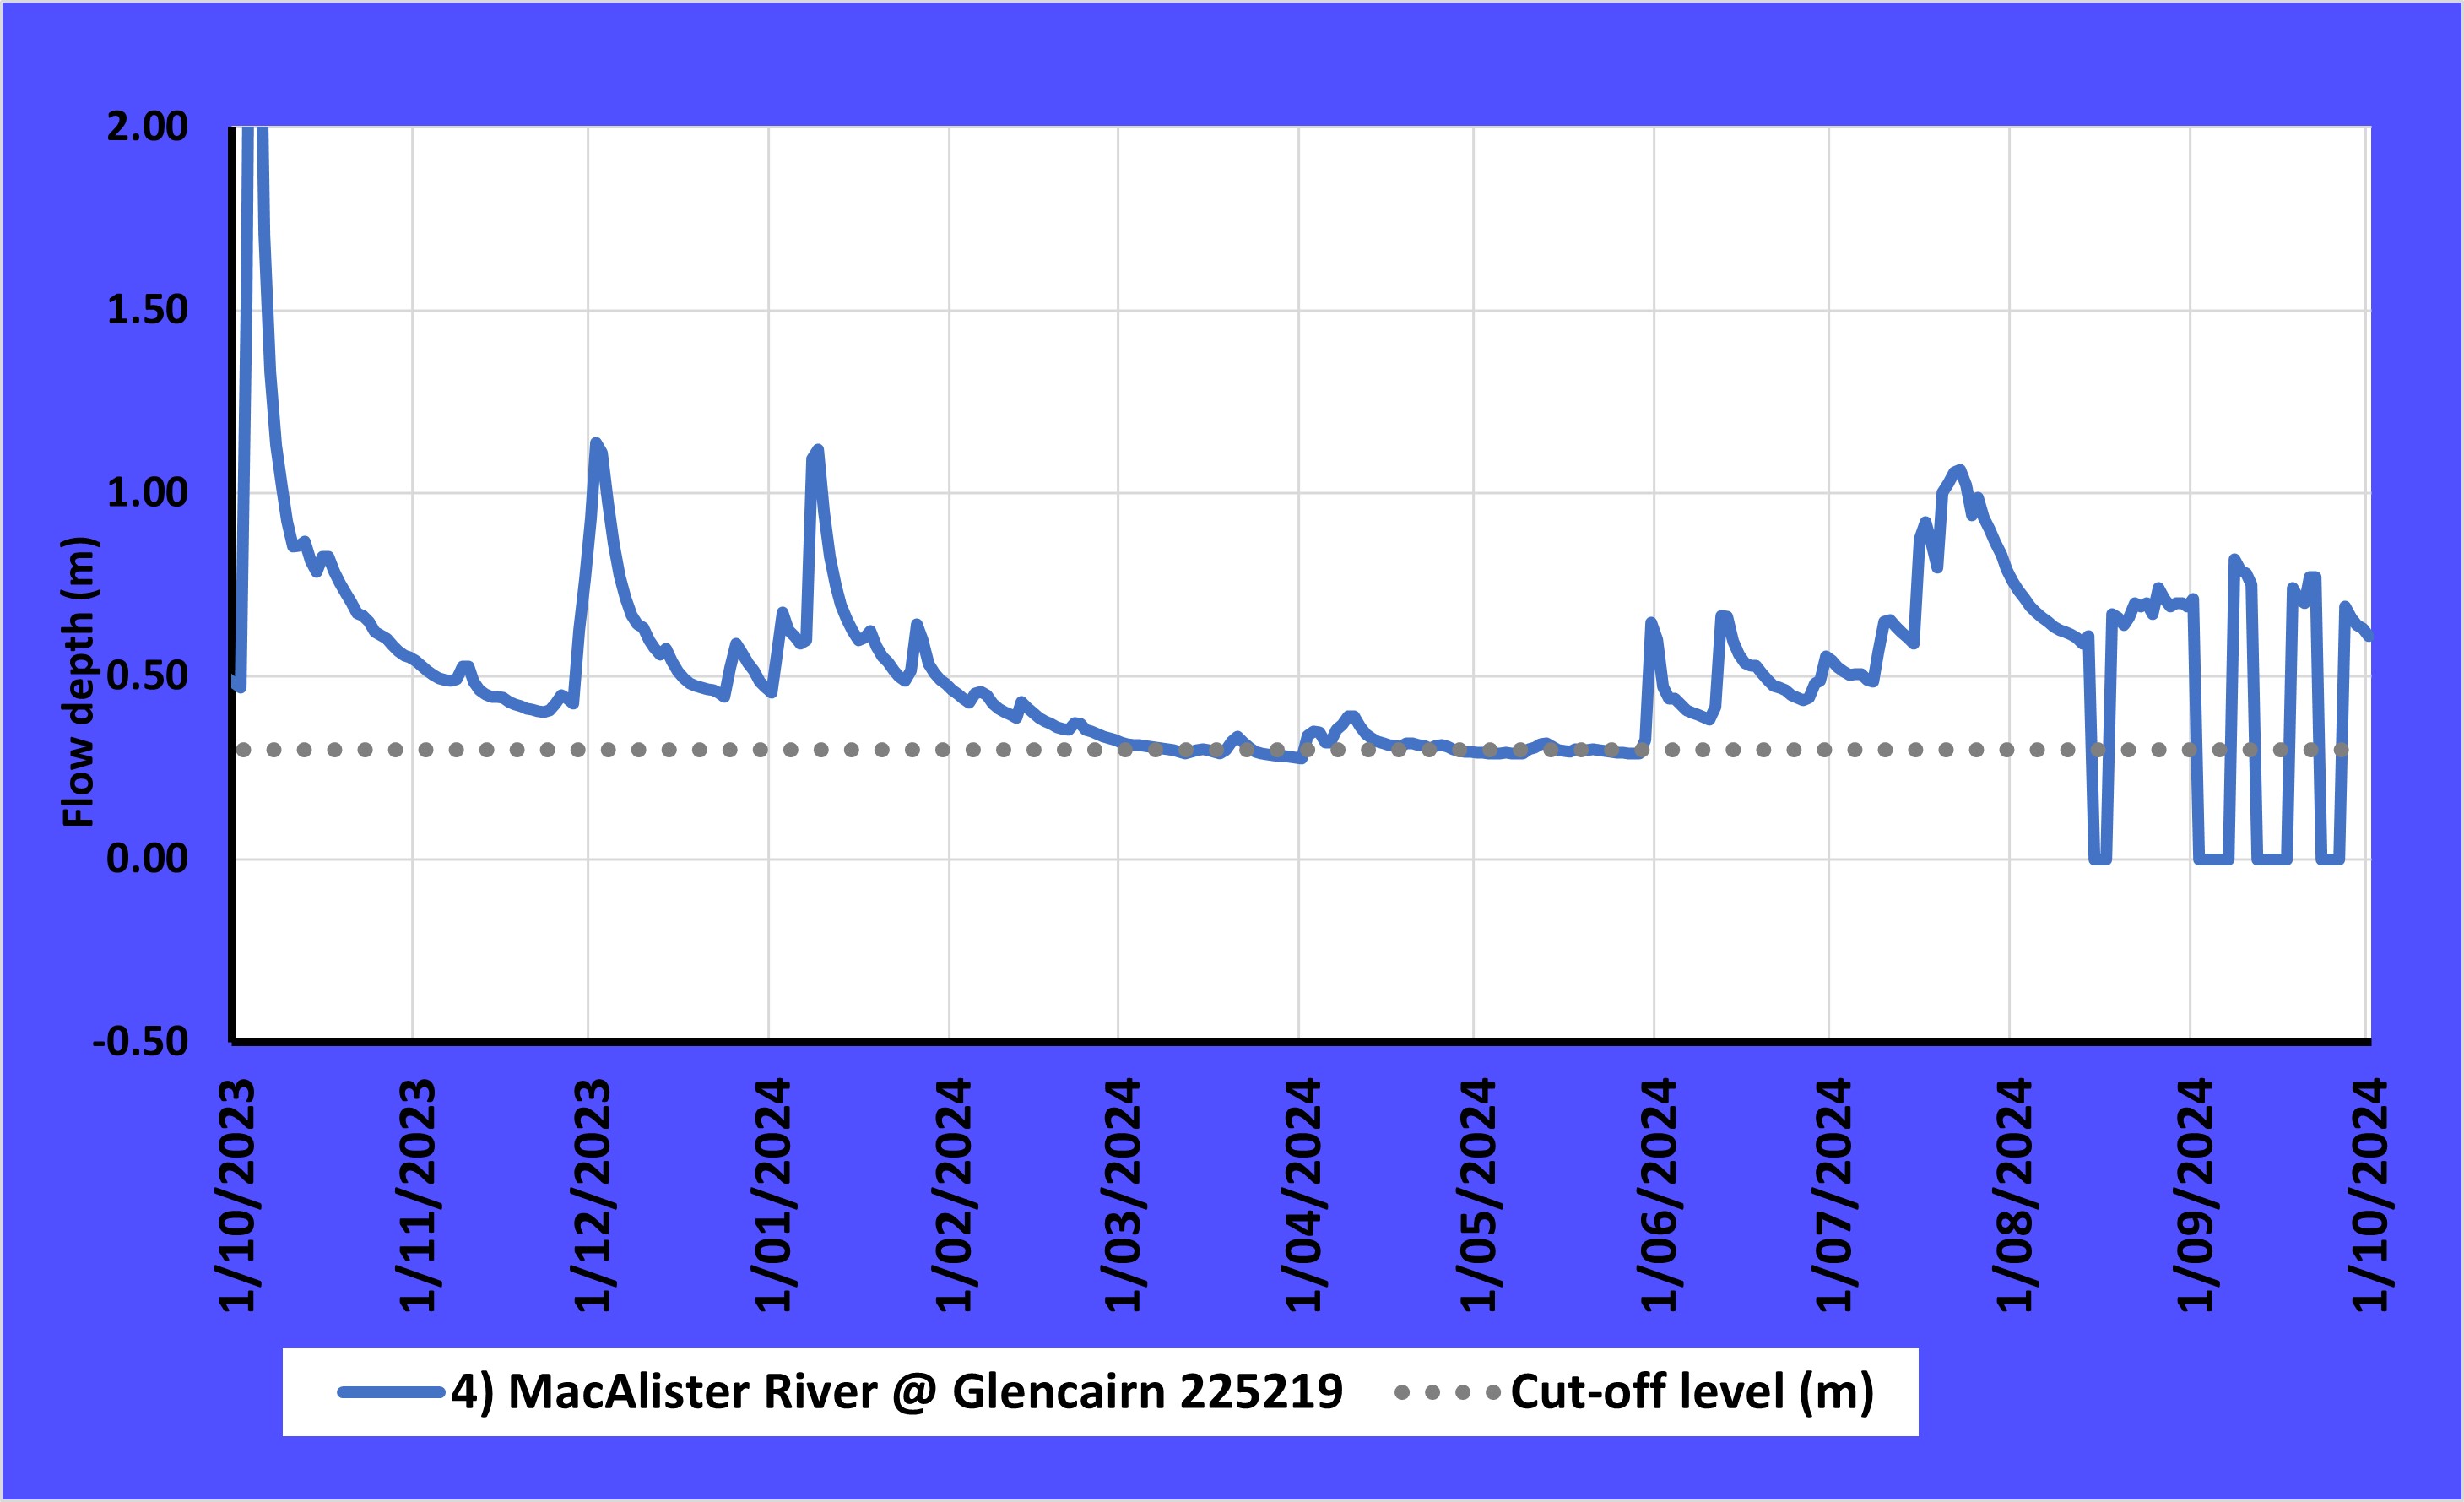
| ||
|
5. Towamba R at Towamba (site ID 220004) Min. level = 0.35 m. | 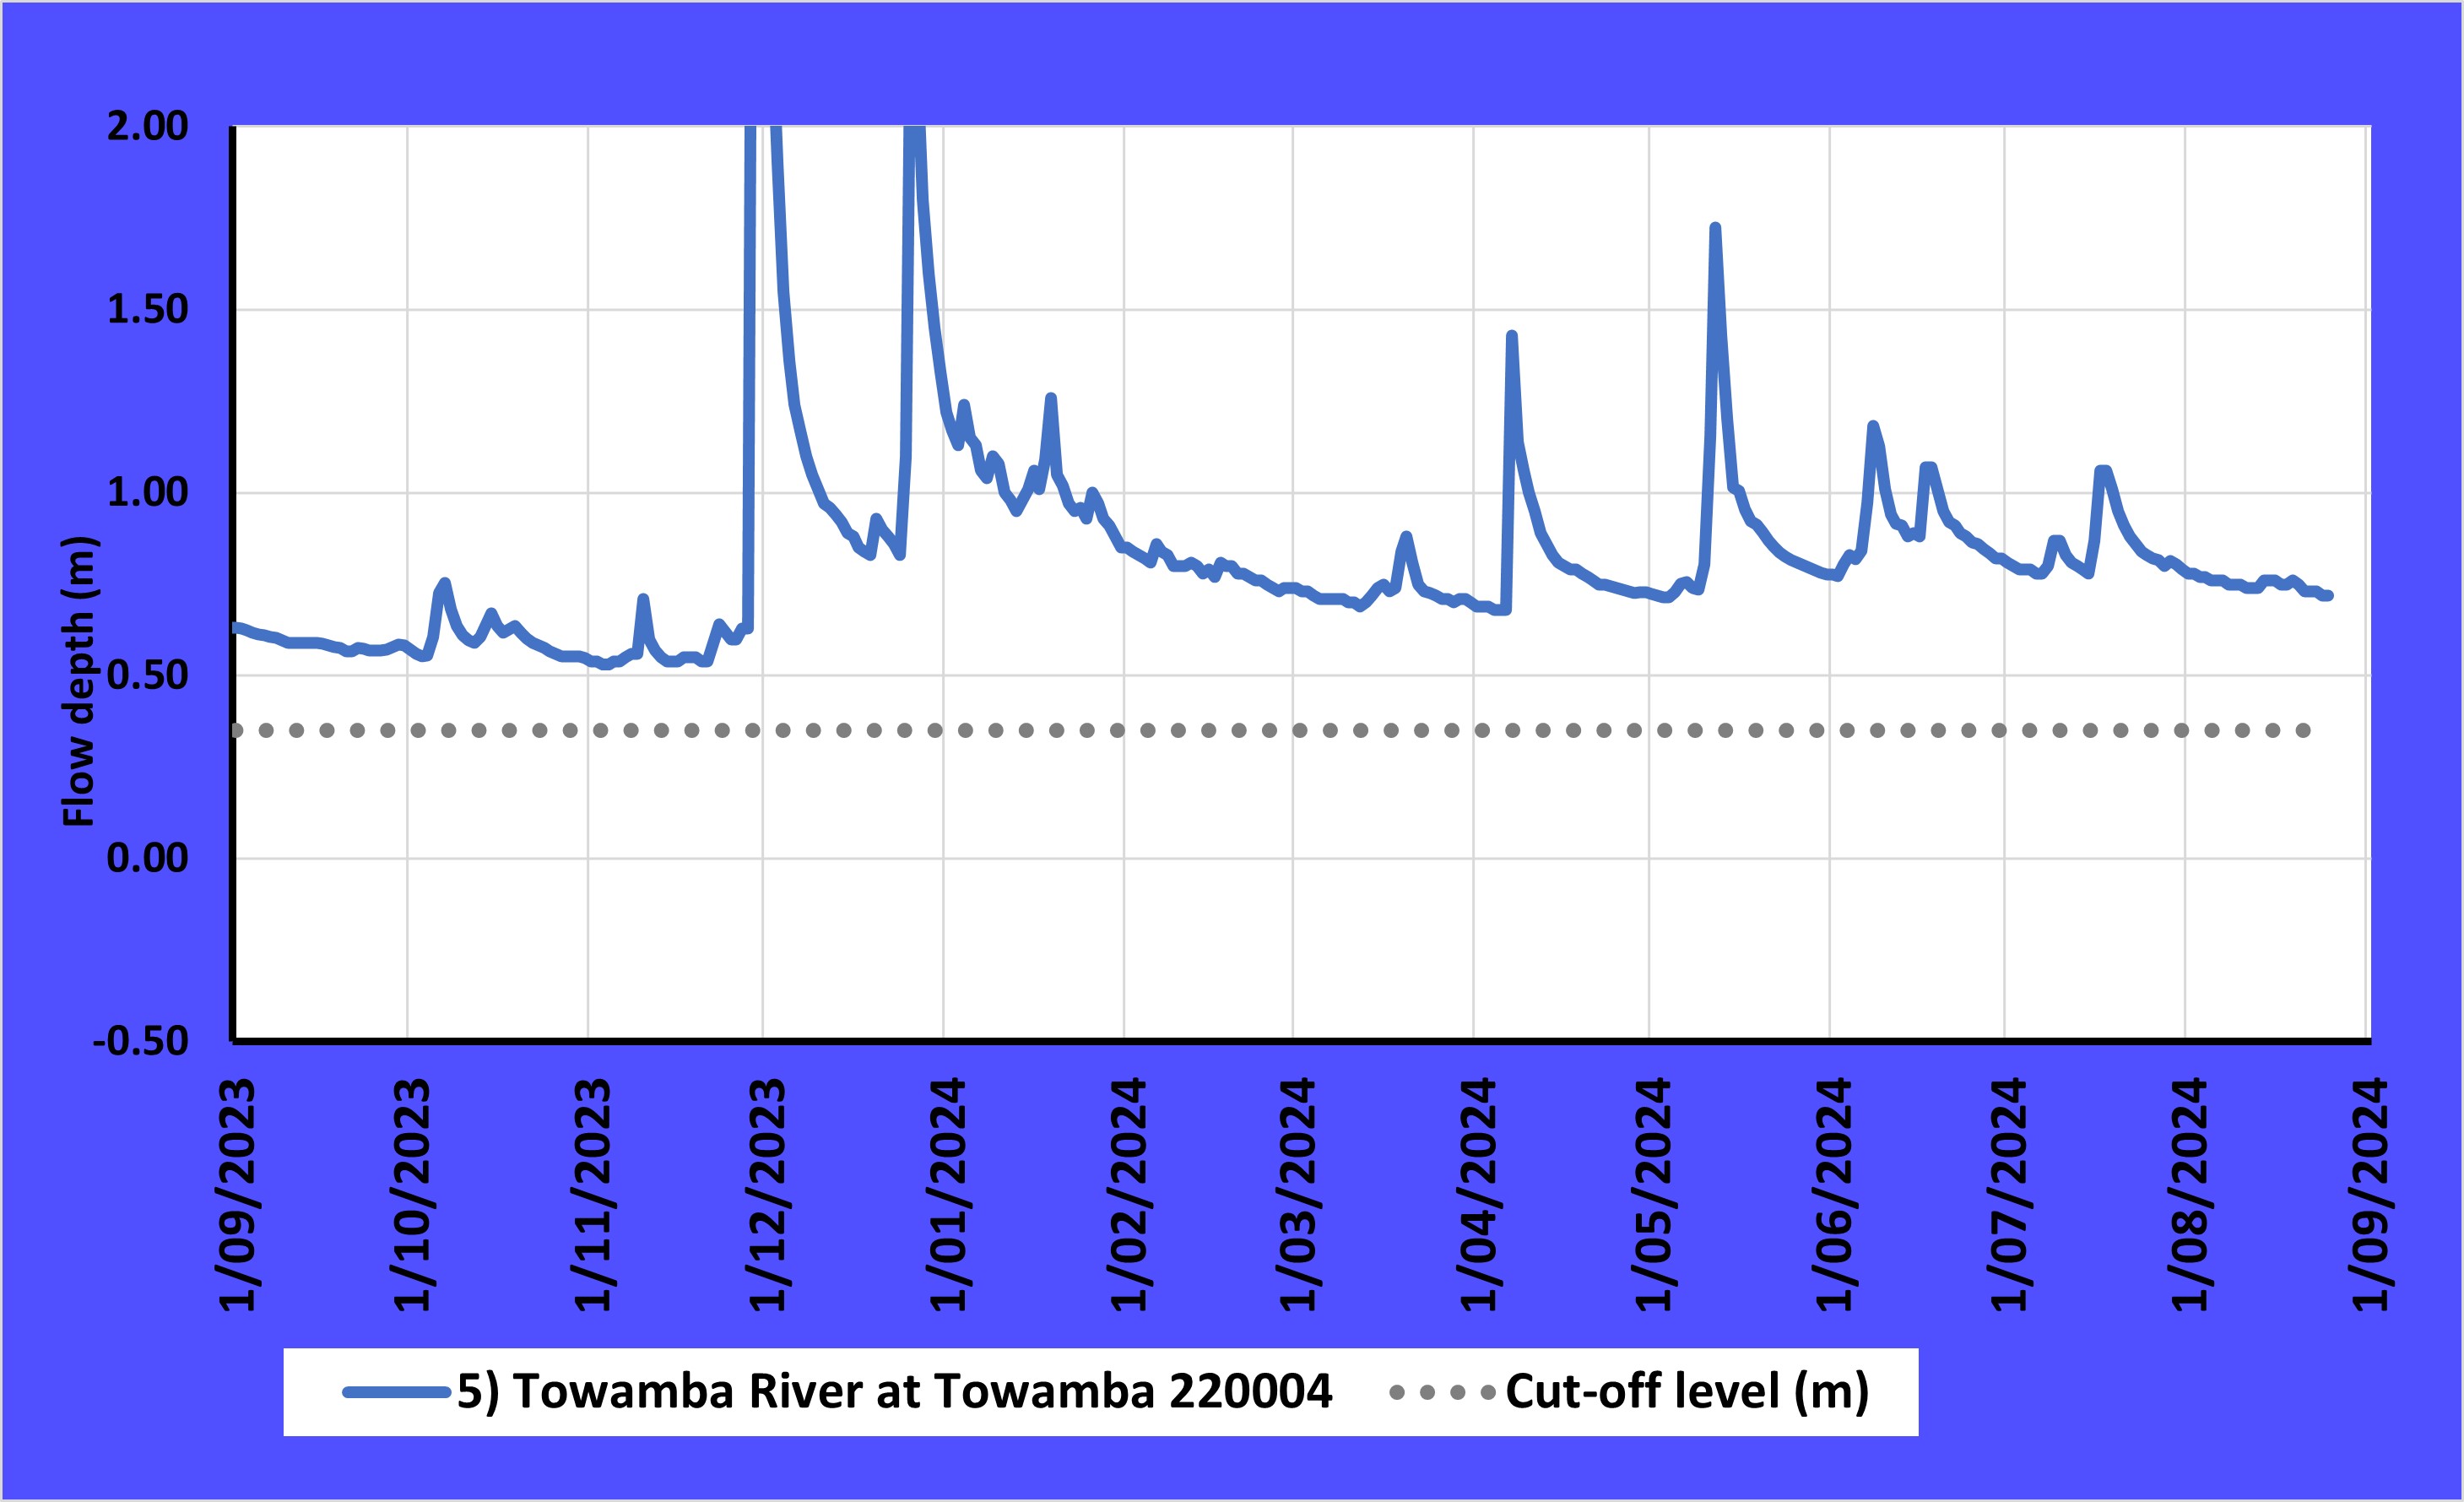
| ||
|
6. Kowmung R at Cedar Ford (site ID 212260) Min. level = 0.40 m. | 
| ||
|
7. Mann R at Mitchell (site ID 204014) Min. level = 0.20 m. | 
| ||
|
8. Clarence R at Paddys Flat (site ID 204051) Min. level = 0.55 m. | 
| ||
|
9. Hastings R at Mt Seaview (site ID 207015 Min. level = 0.55 m. | 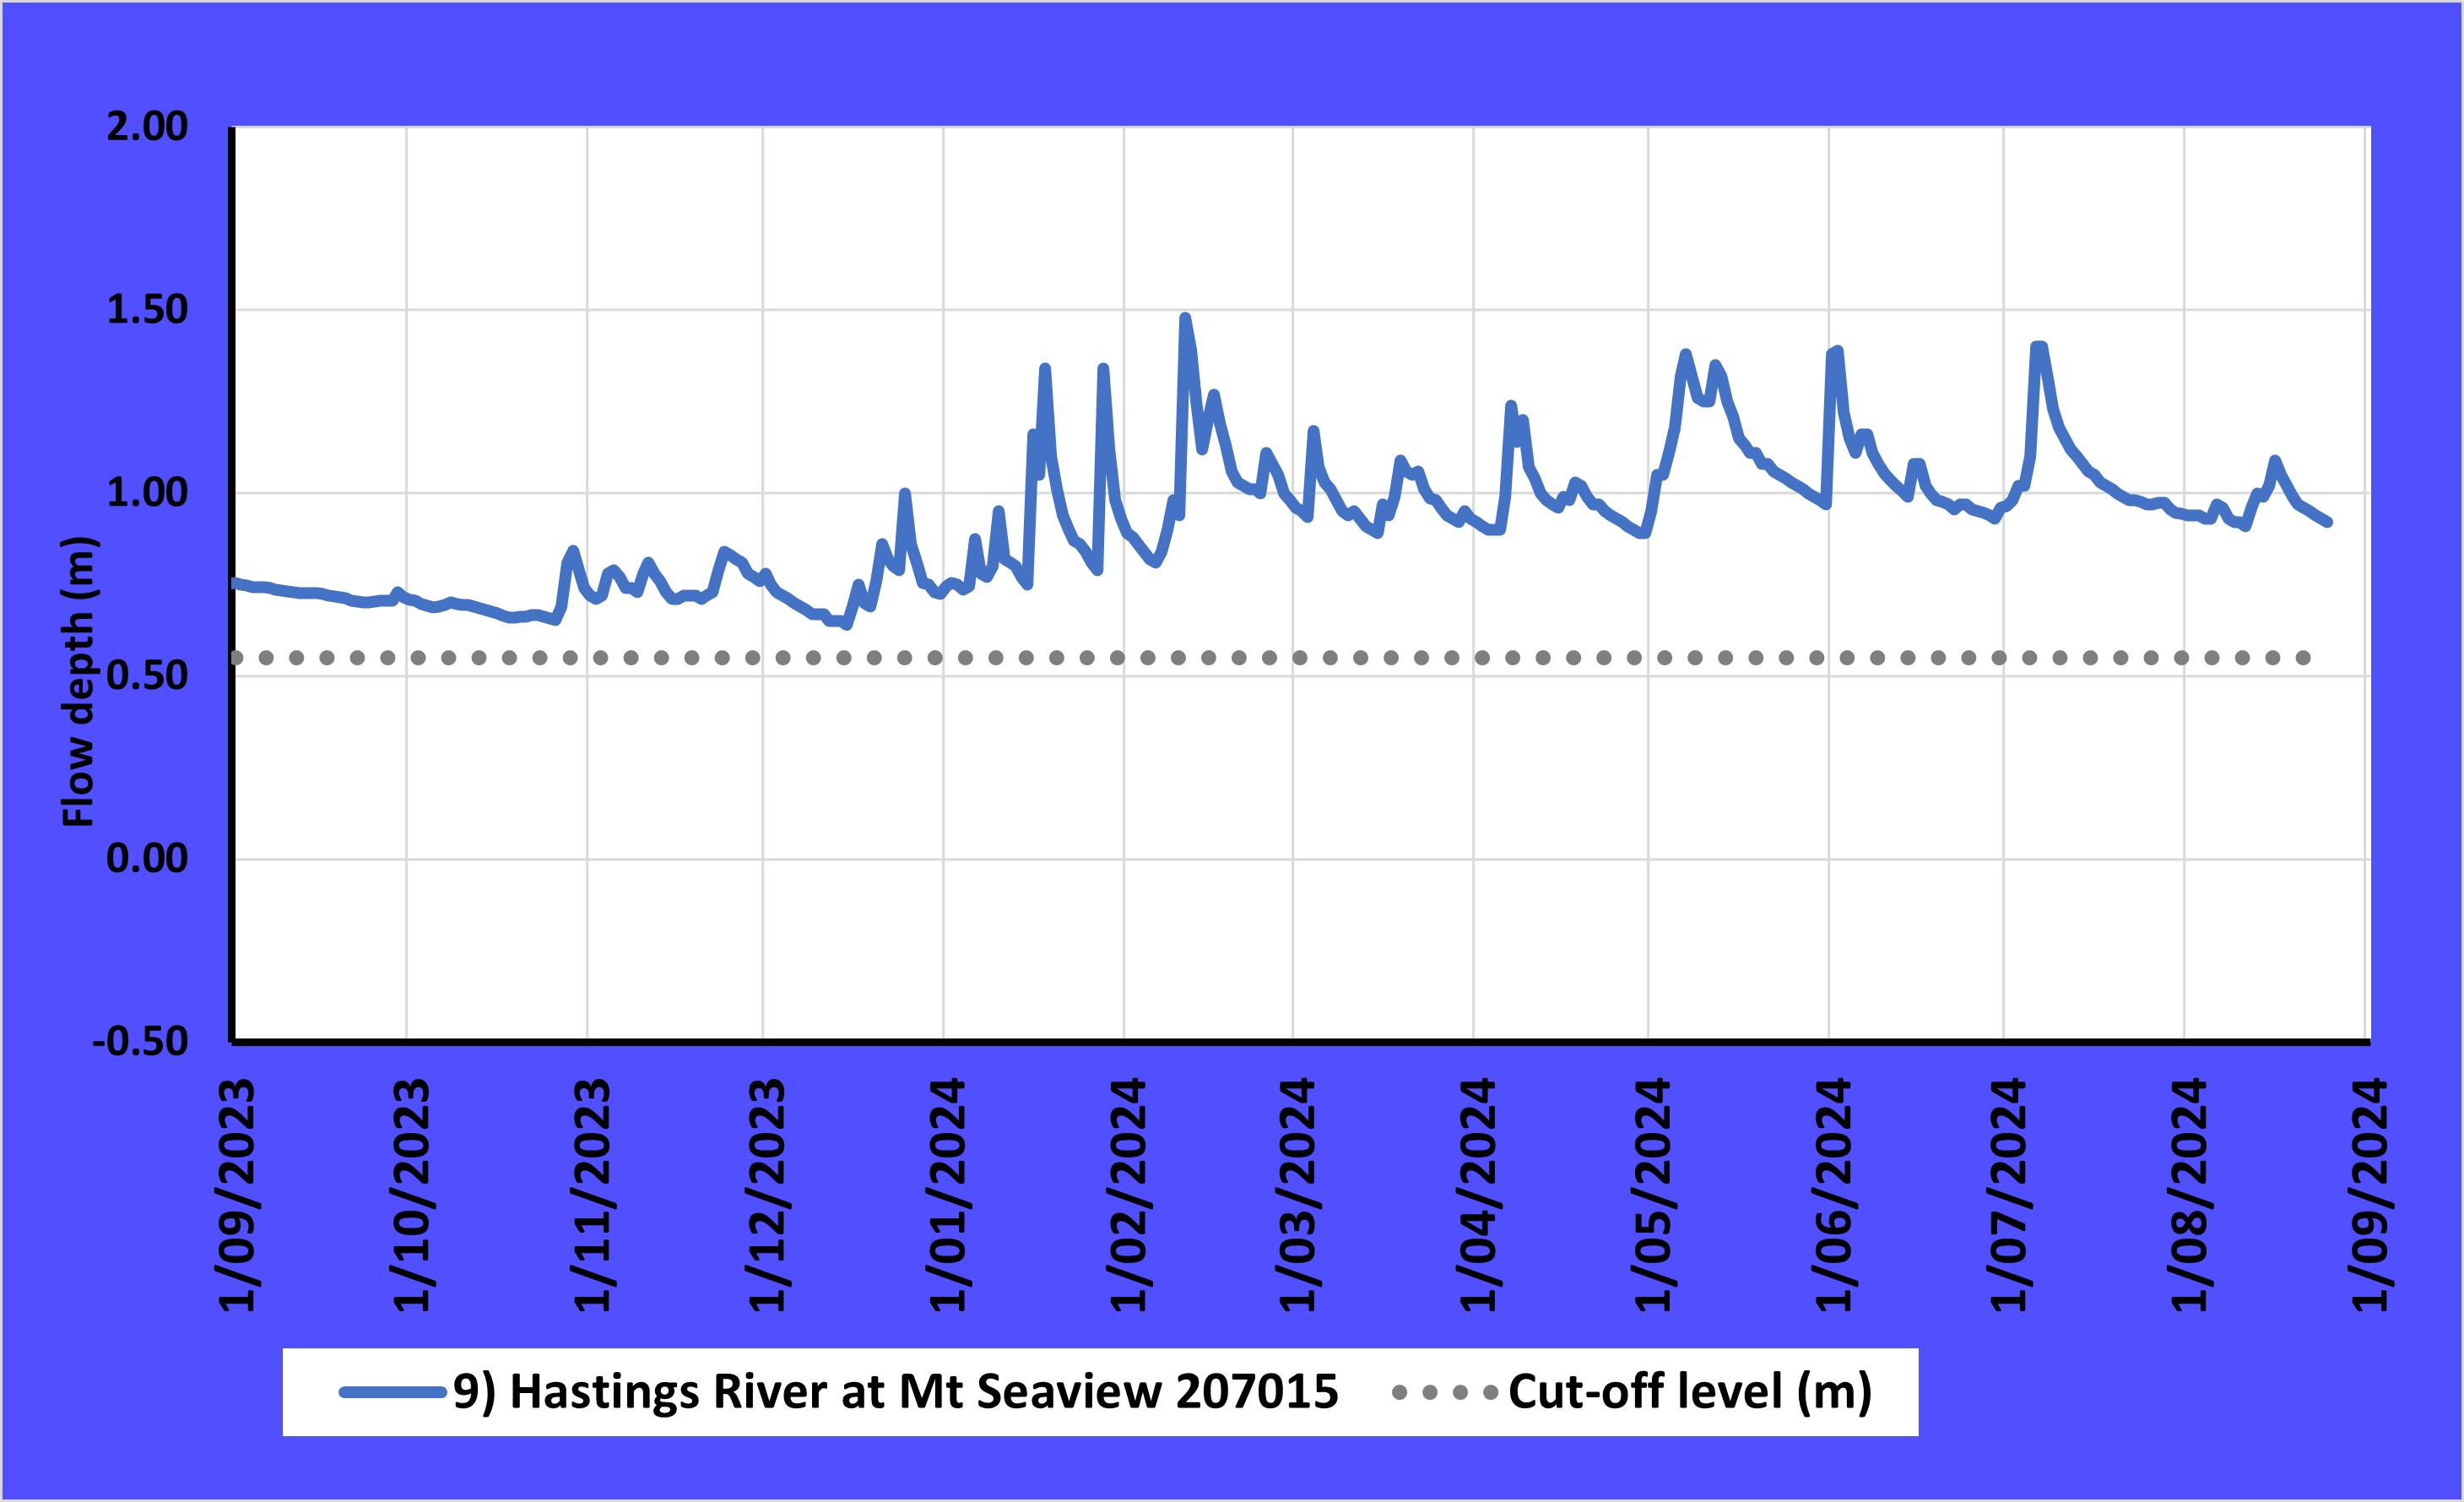
| ||
|
10. Barrington R at Bobs Crossing (site ID 208001) Min. level = 0.58 m. | 
| ||
|
11. Murrumbidgee R above Tantangara Reservoir (site ID 410535) Min. level = 0.45 m. | 
| ||
|
12. Tooma River at Pinegrove (site ID 401014B) Min. level = 0.88m. | 
| ||
|
13. Shoalhaven R at Hillview (site ID 215208) Min. level = 0.45 m. | 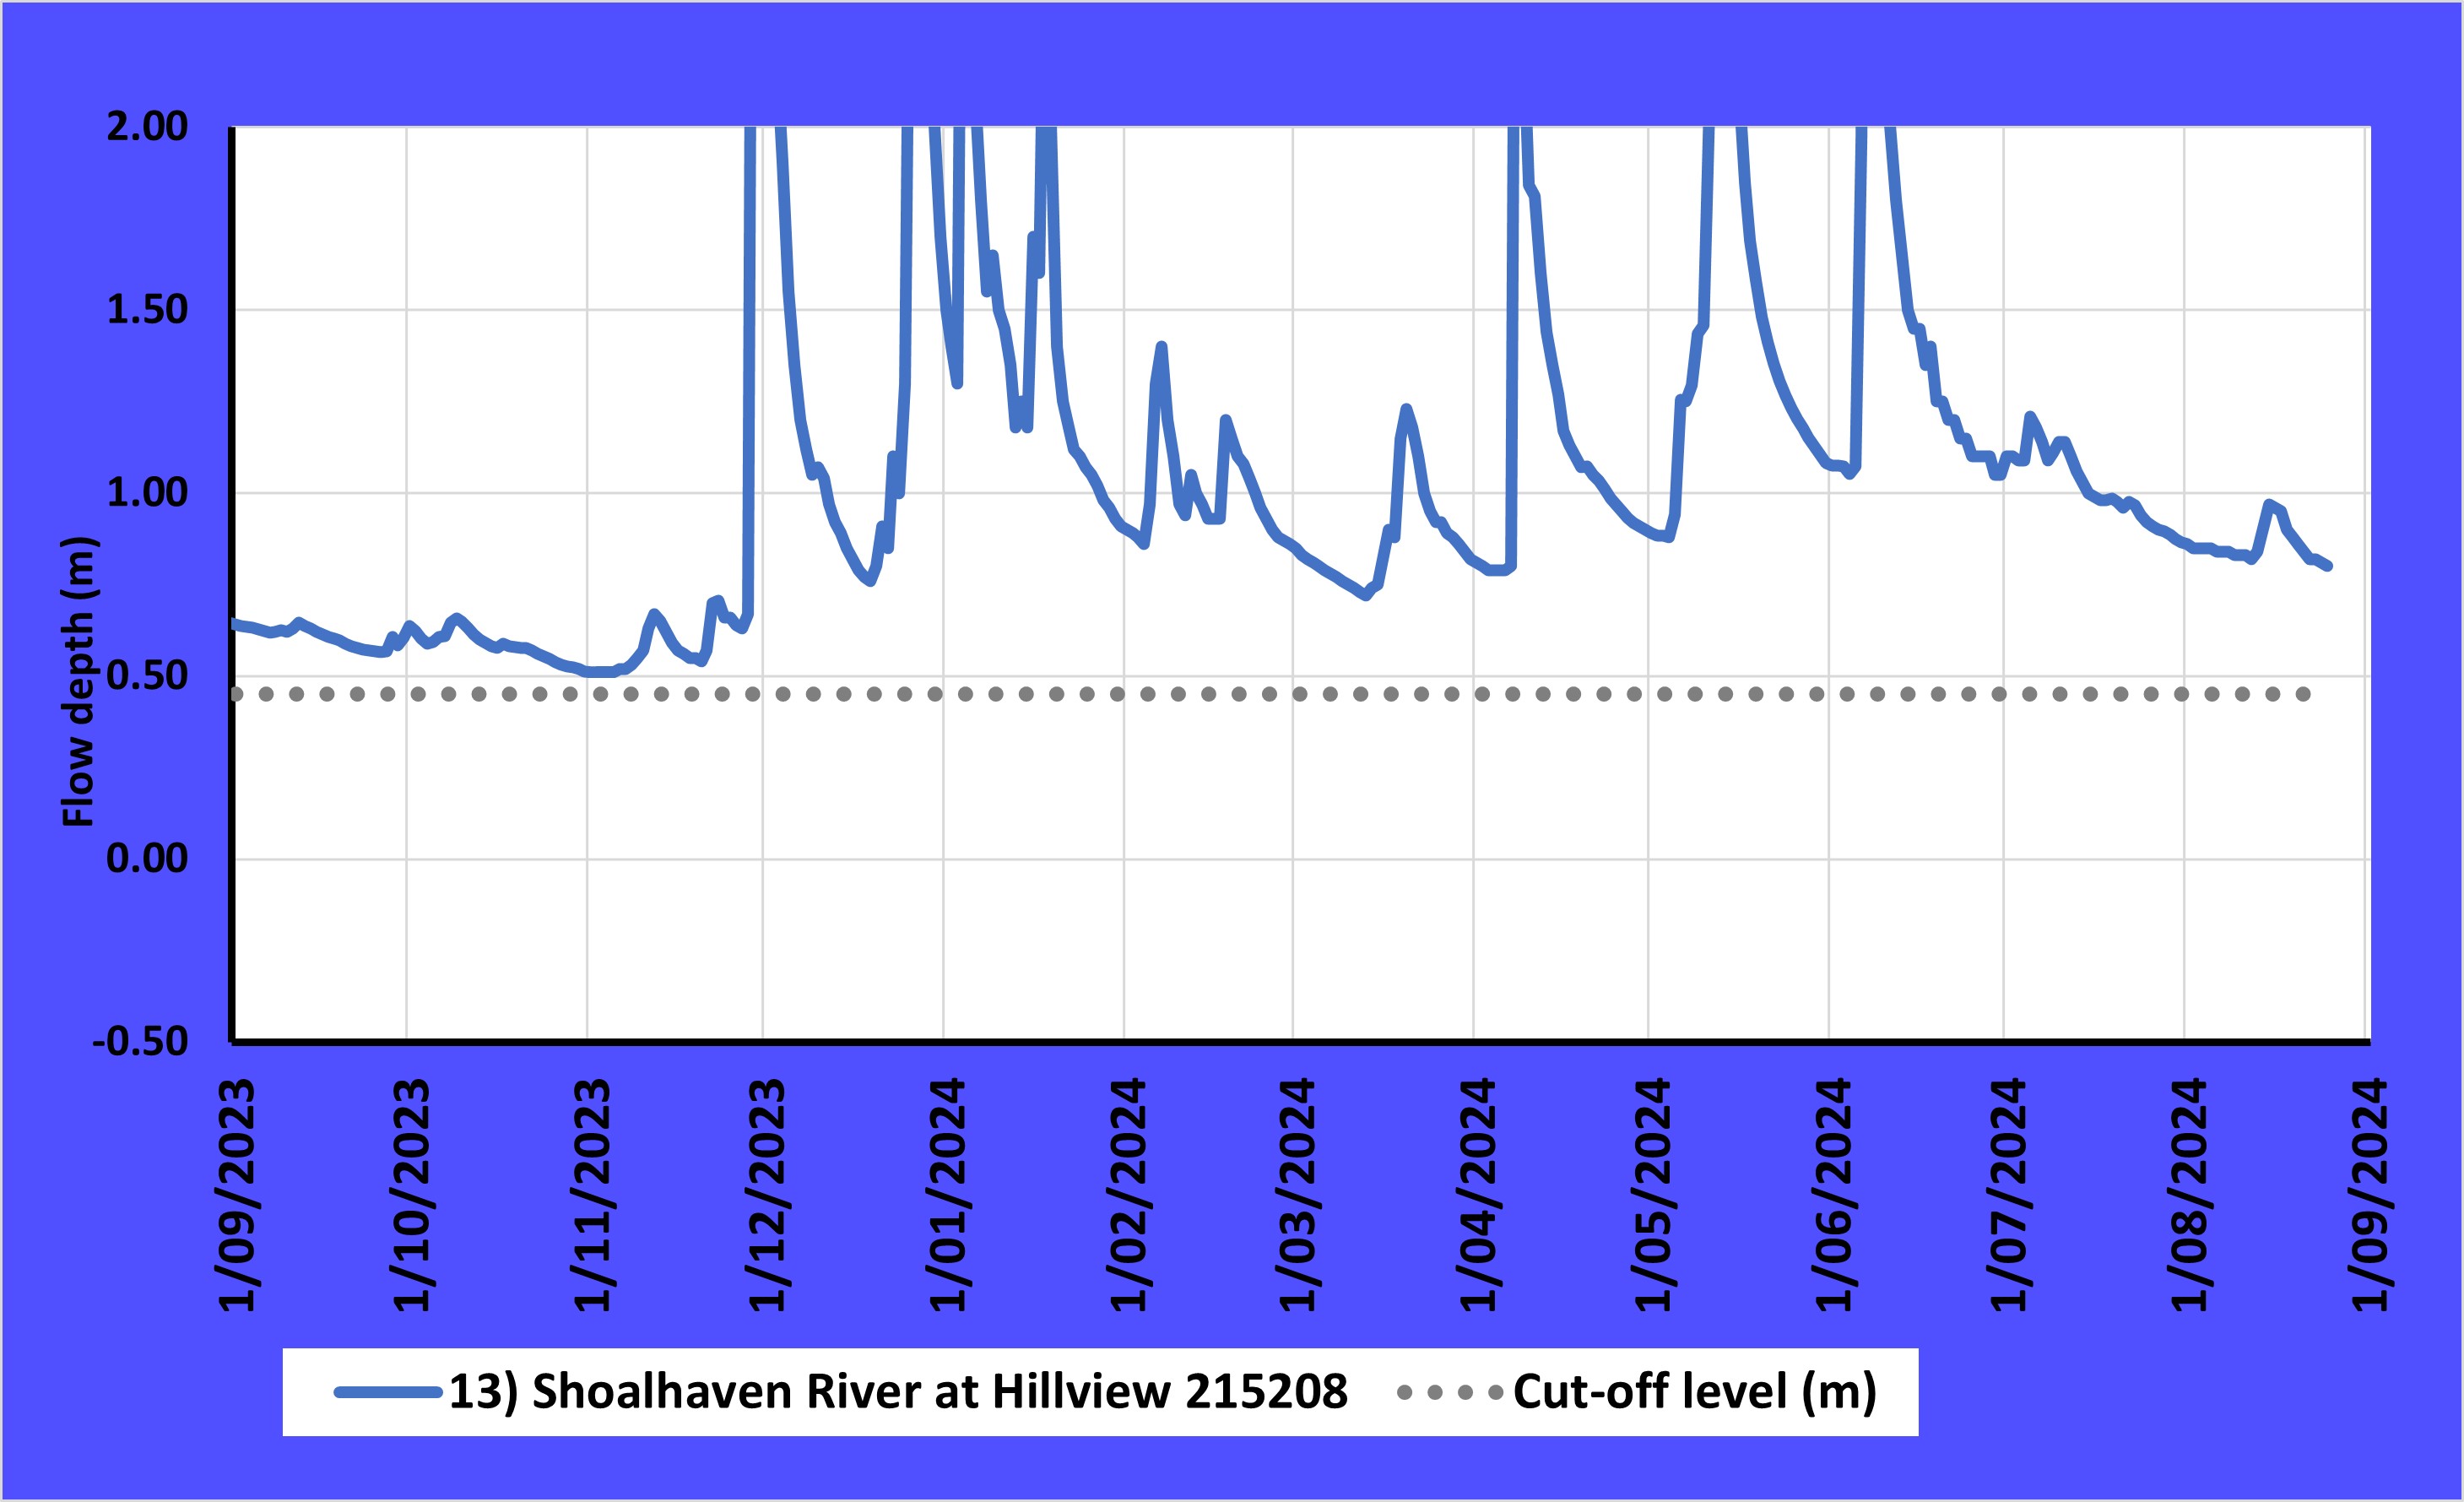
| ||
|
14. Queanbeyan R at Tinderry (site ID 410734) Min. level = 0.70 m. | 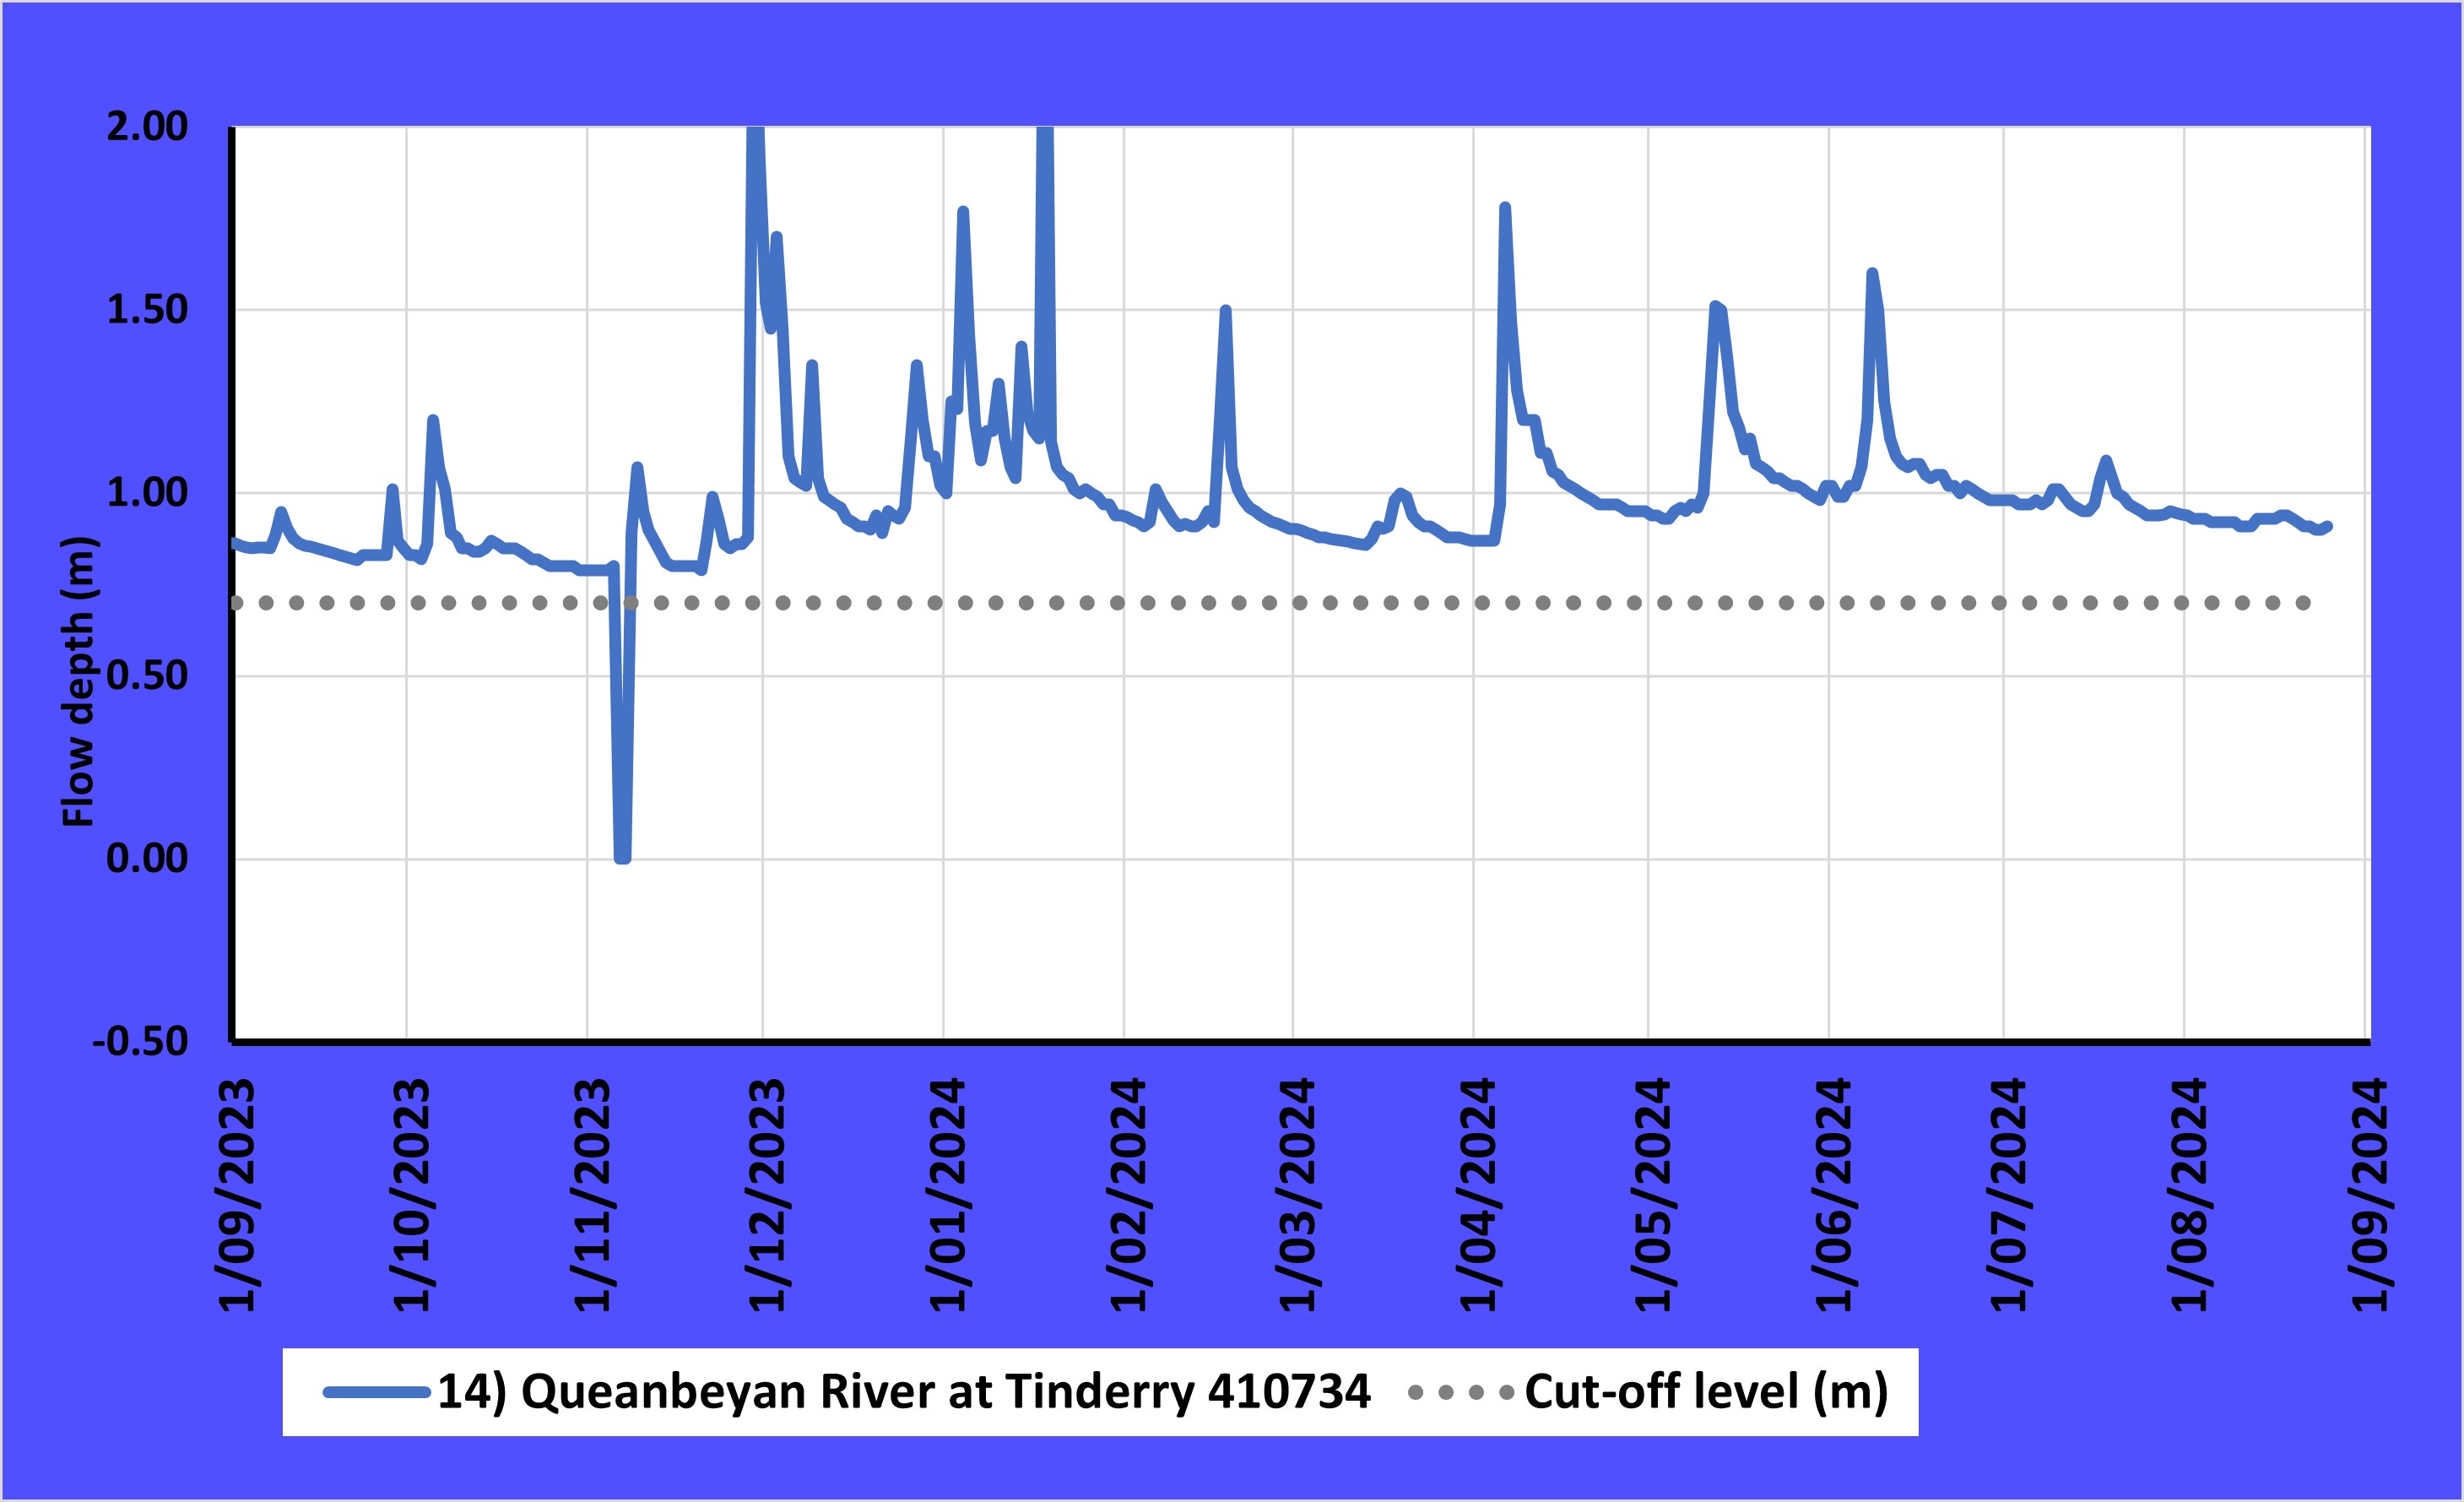
| ||
|
15. Reedy Creek (site ID 403221) Min. level = 0.22 m. | 
| ||
|
16. Wadbilliga R at Wadbilliga (site ID 218007) Min. level = 0.75 m. | 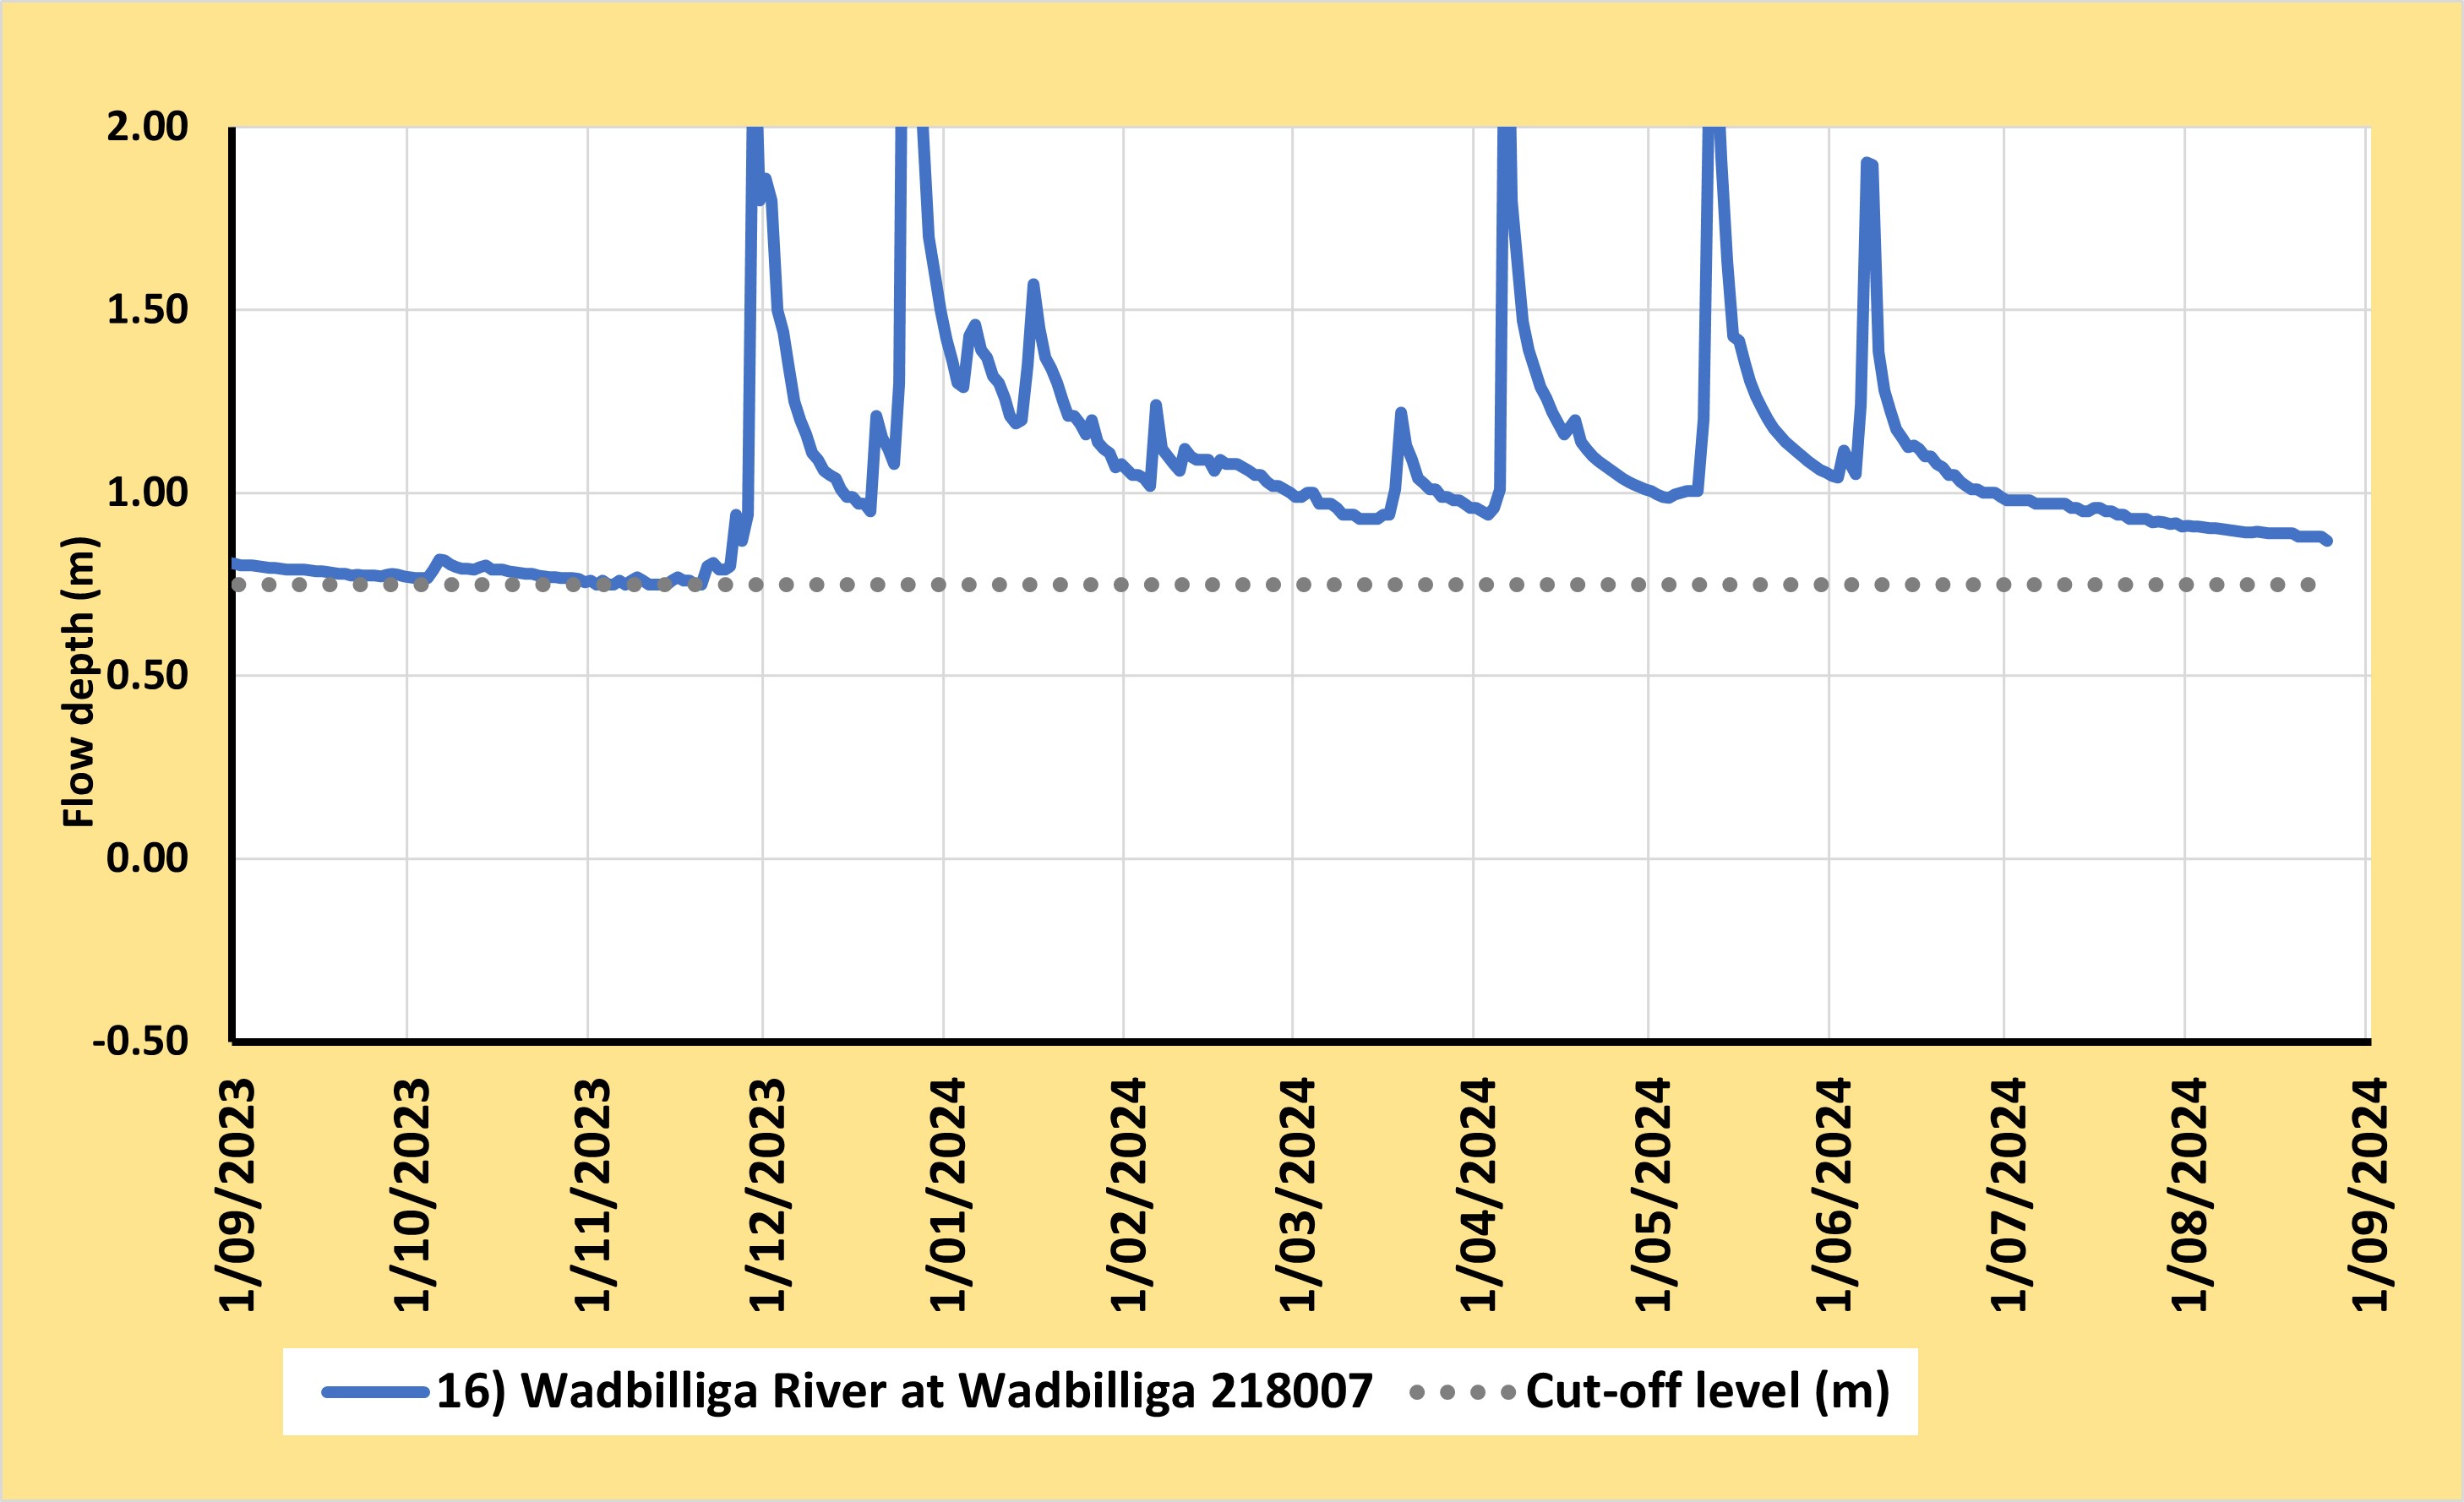
| ||
|
17. Gudgenby R at Mt Tennent (site ID 410731) Min. level = 0.45 m. | 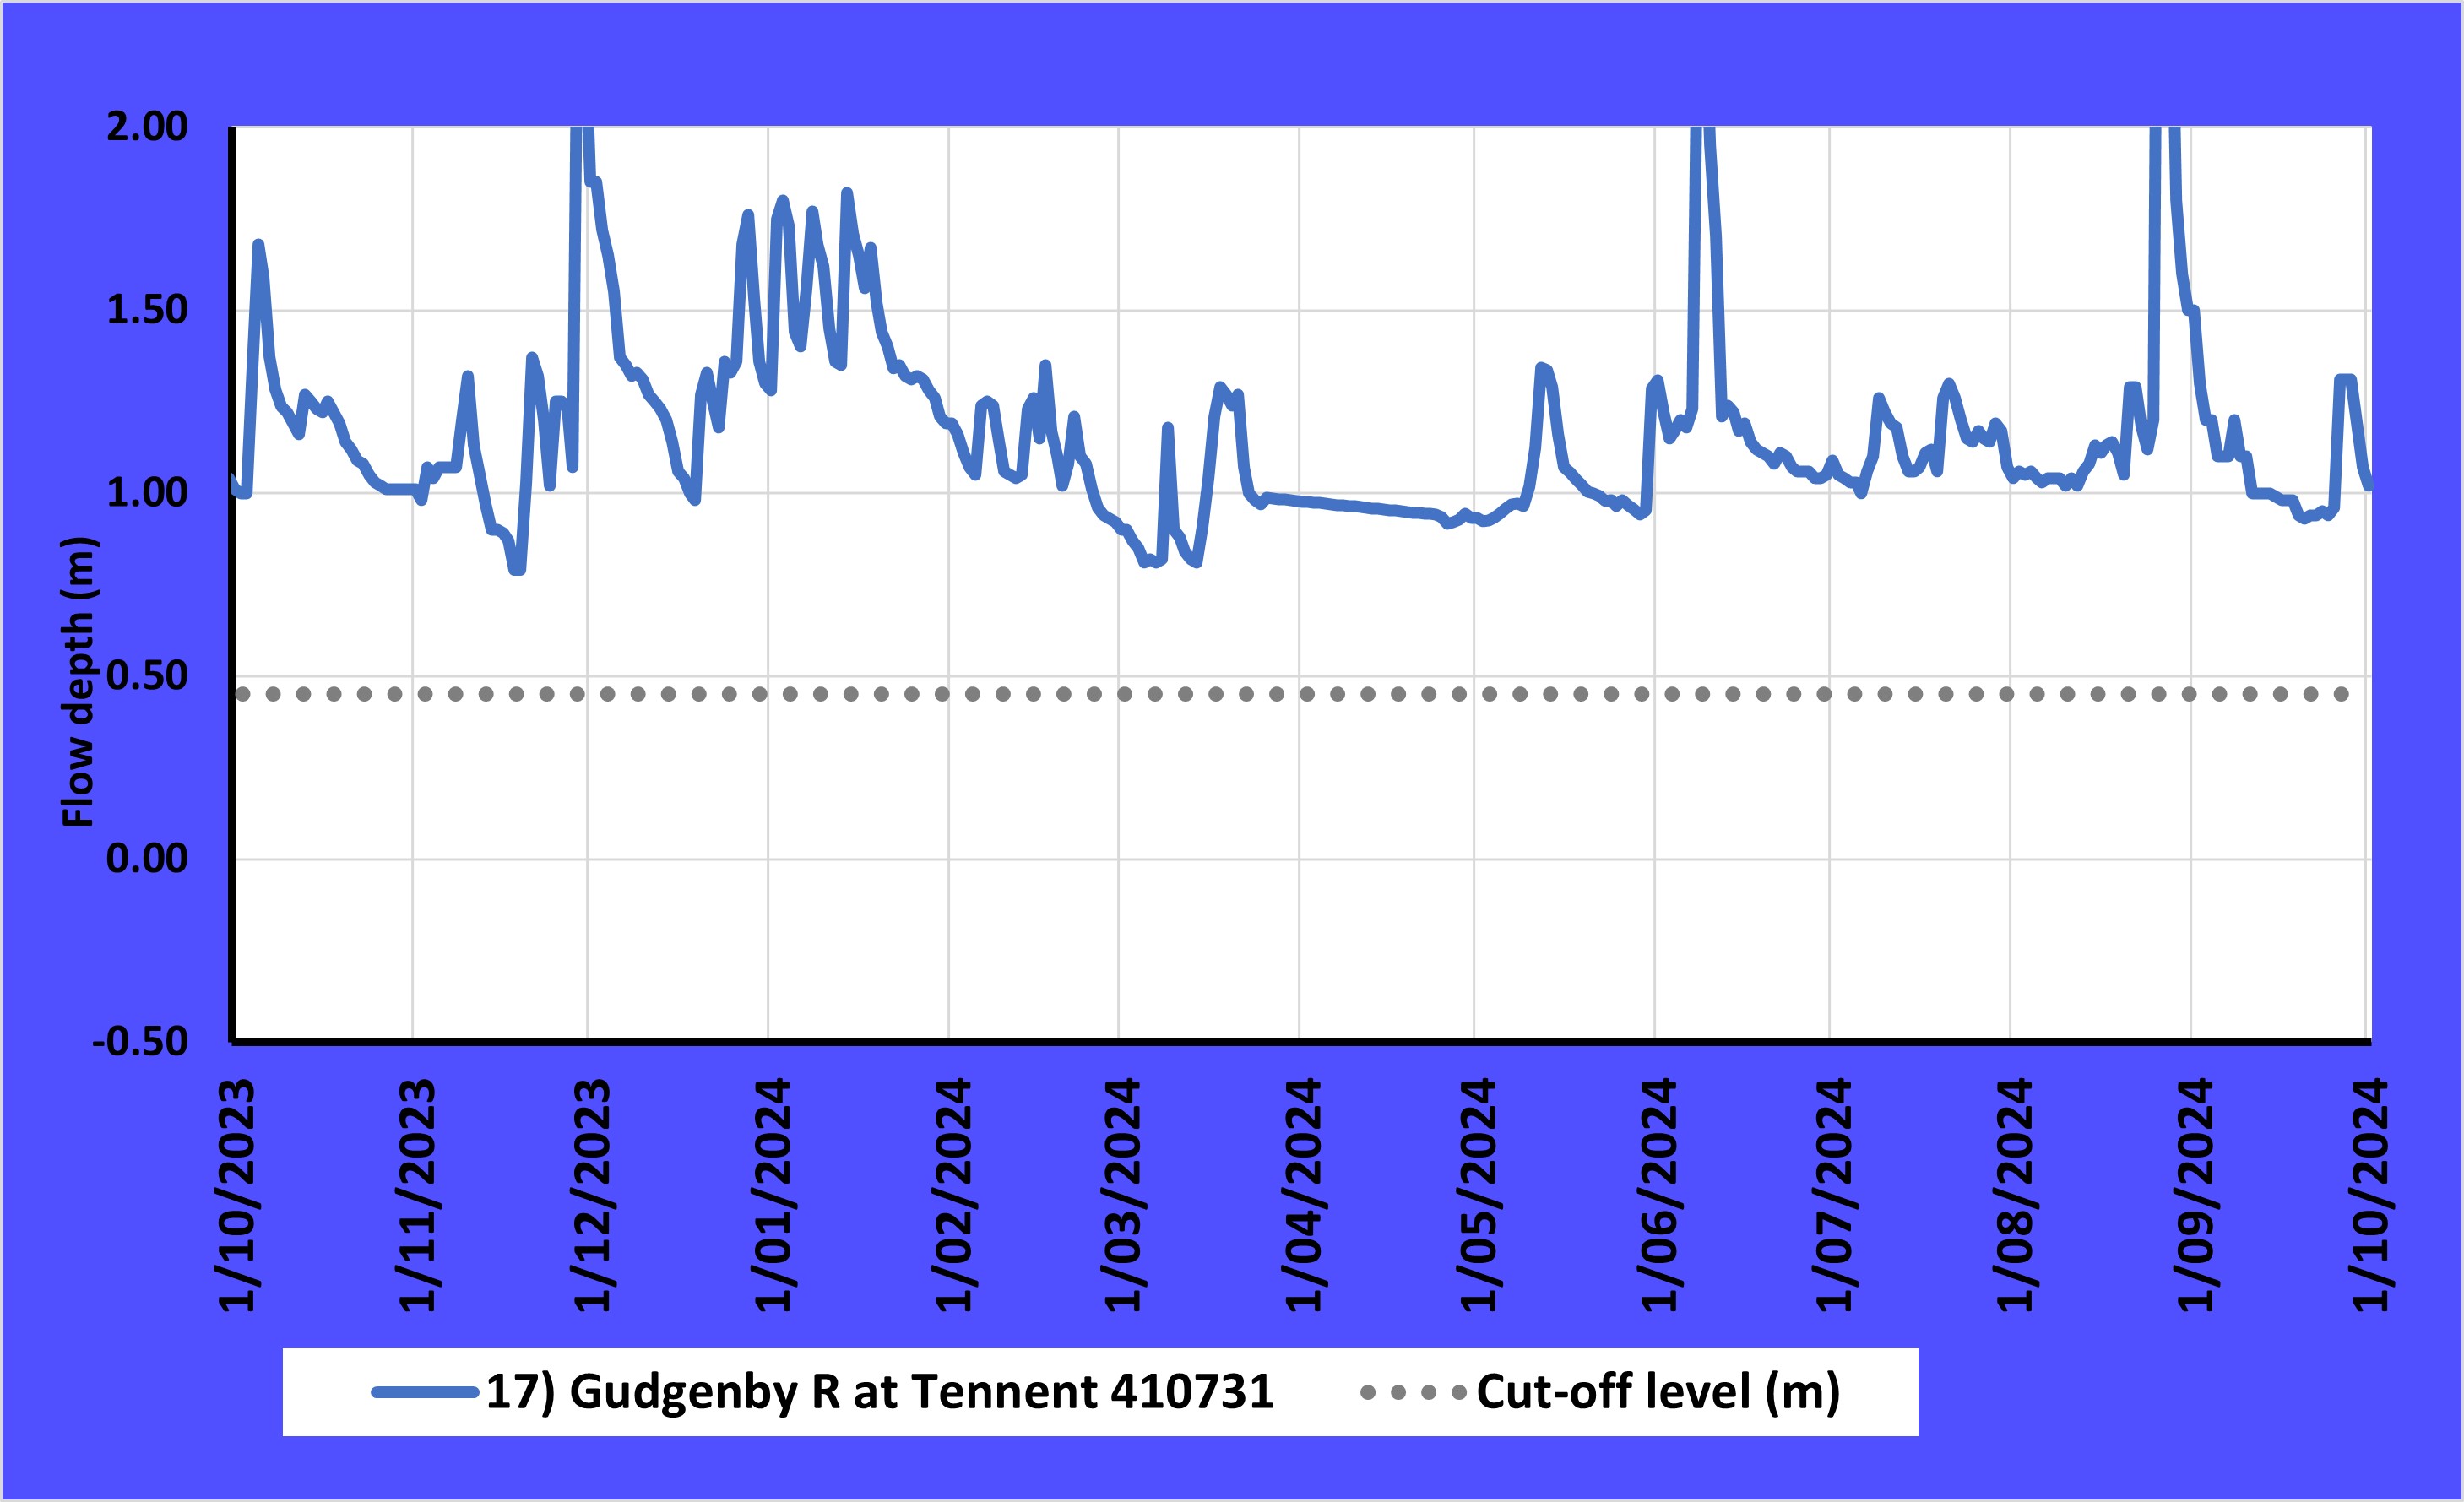
| ||
|
18. Hopkins R at Ararat (site ID 236219) Min. level = 0.075 m. | 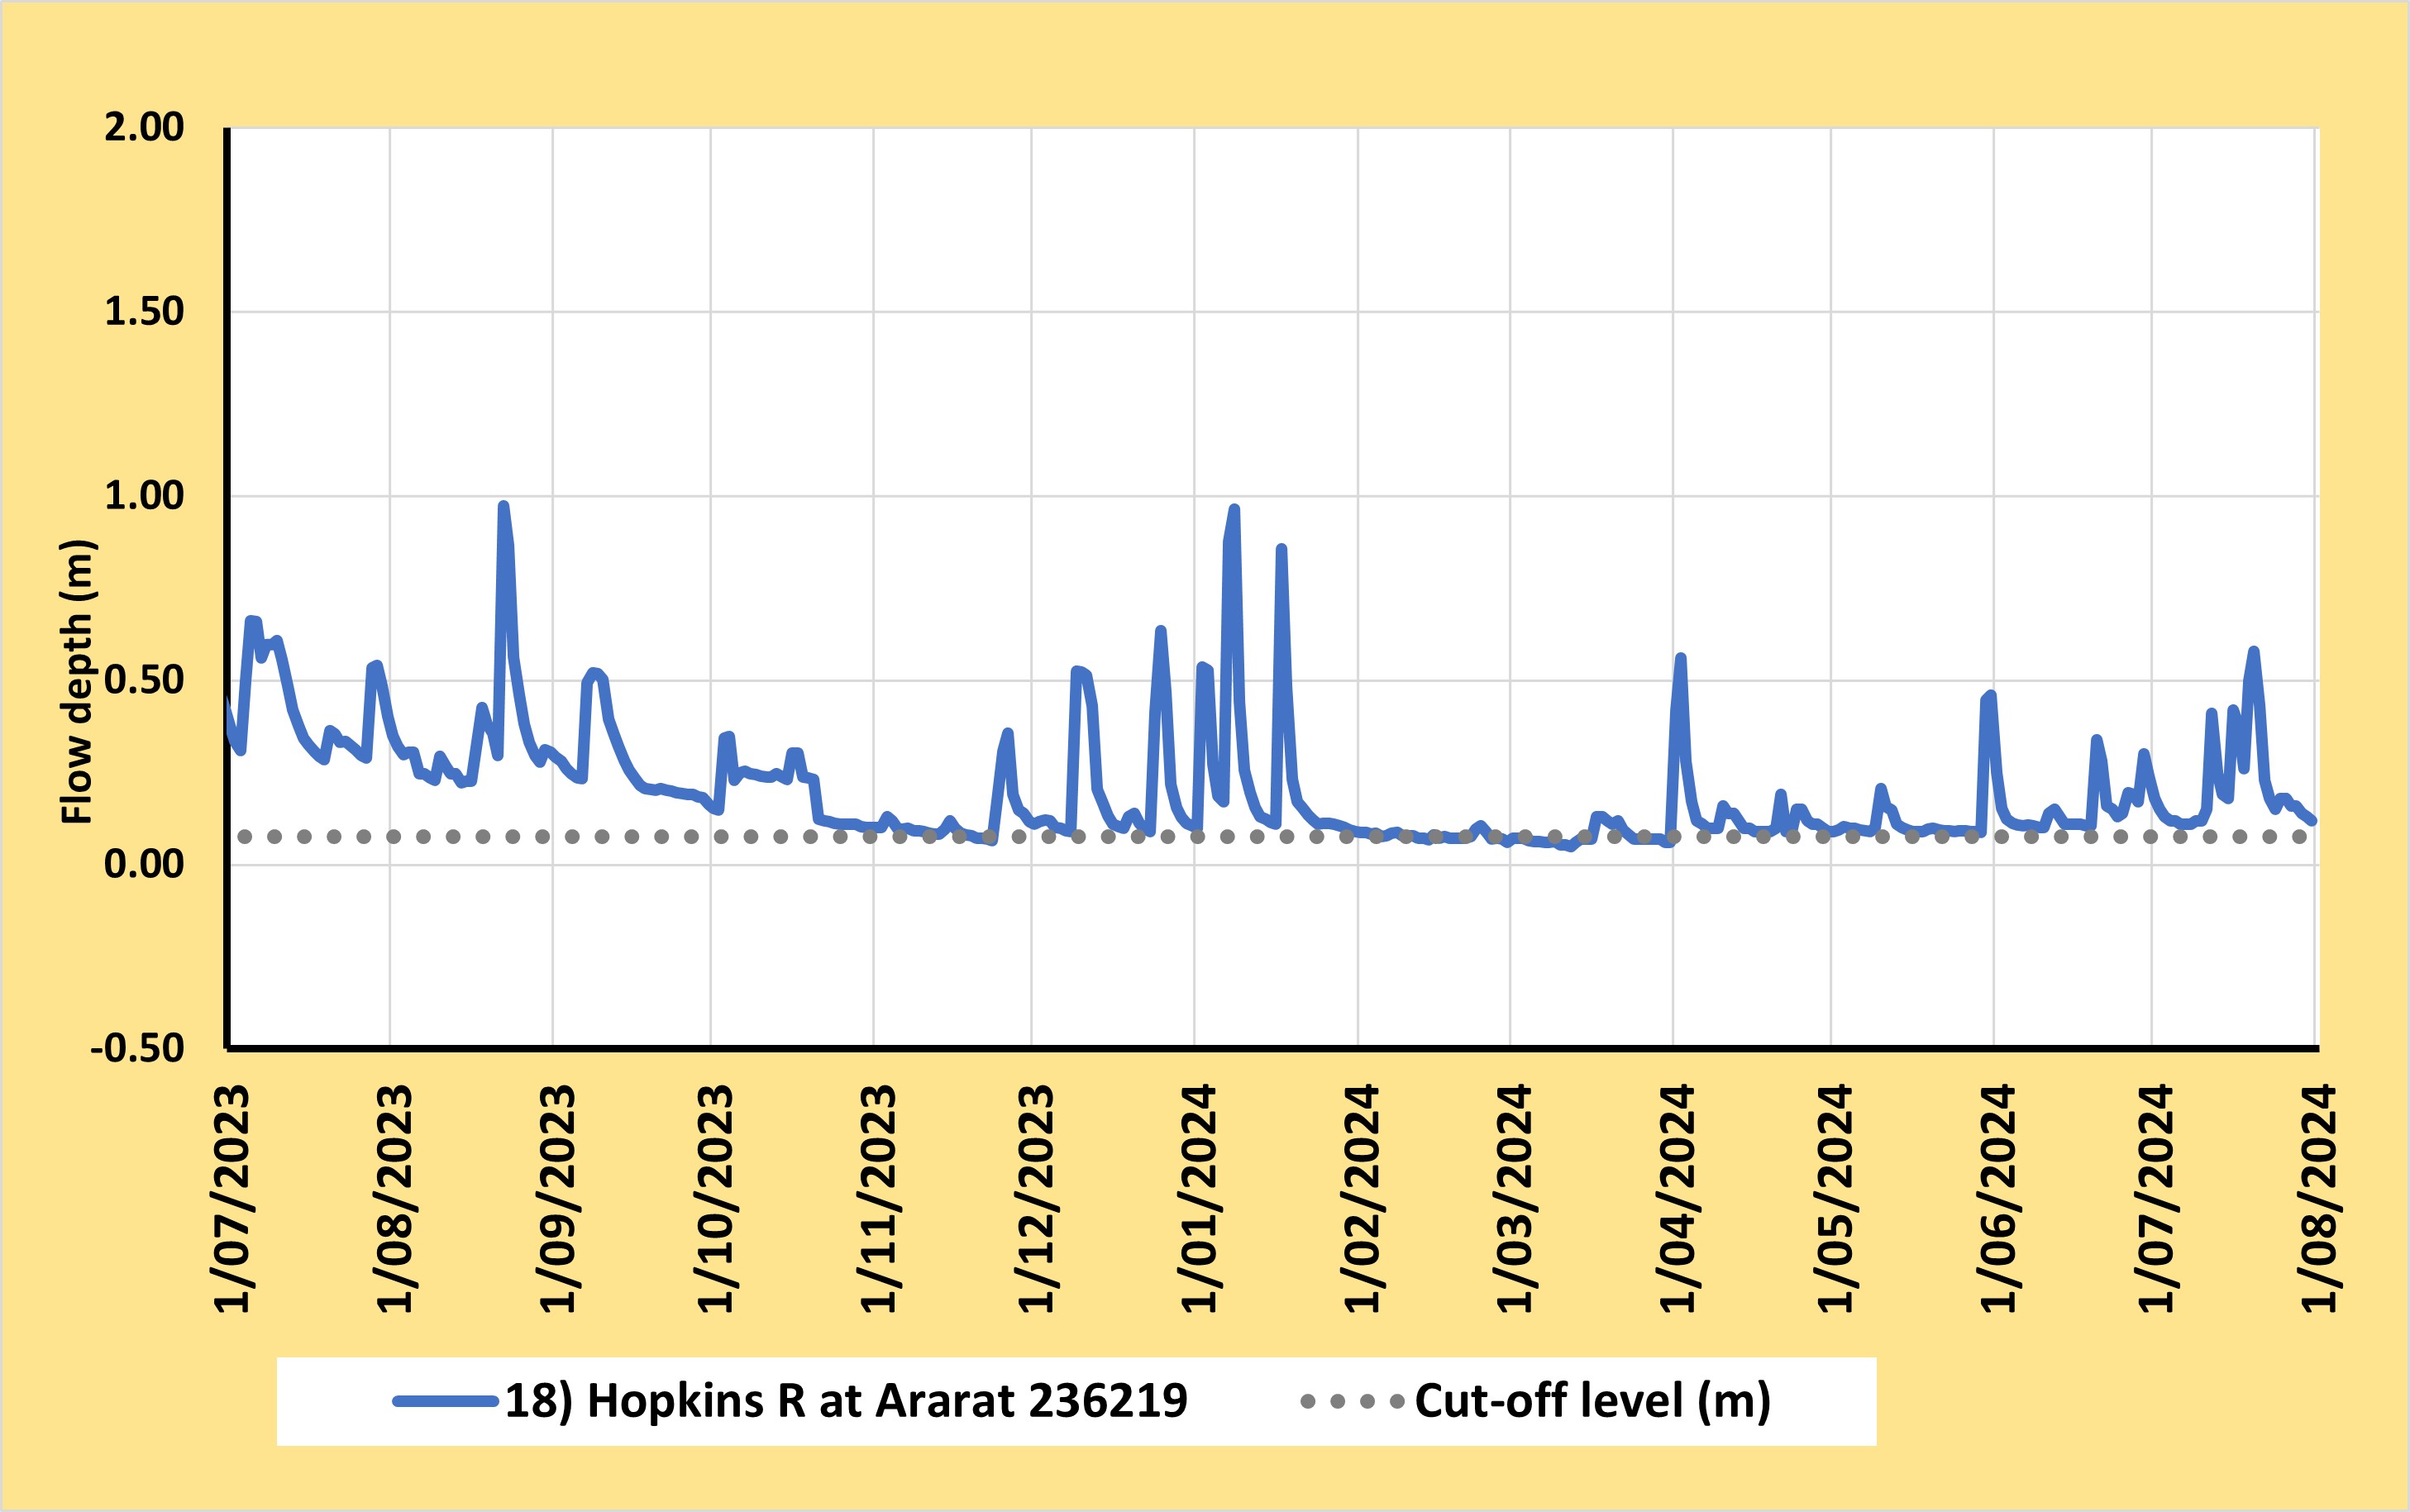
| ||
ARCHIVE--- End of list --- |