| LINK | CONTENT | |
Queensland bushfires, Nov 2018 | The late November 2018 outbreak of bushfires in SE Queensland was exceptional in many ways. | |
| Real colour | Real colour. | |
| 2.2 um IR | Near infrared. Fires show up as stationary white dots or areas. Note that night-time imagery is not provided. | |
| 3.9 um IR | Near infrared. Colours show hot ground or fires. Look for white areas that stand-out from the yellow-themed hot ground. Note that night-time imagery is not provided. | |
| Dust RGB | EUMETSAT Dust RGB product. Raised dust shows up as solid magenta. | |
| Low level WV | Low-level water vapour imagery showing the atmospheric strucure above the fires. The dark red to black bands are very dry air. Note the gravity wave structure. Note also the sea breeze fronts later in the sequence, and the large thunderstorm cells near the end. (There are a few missing images. This is a long sequence and a large file (340 MB).) | |
20181115 | 15th November, 2018. A large wildfire, east of Port Hedland in WA, makes a run to the west. It travels about 70km before noon on a 40°C day. It interacts with the atmosphere (WV band) and forms a plume cloud that generates lightning at 0850UTC. It is NOT a pyroCb, but is part of a cluster of violent pyro-convective events that have challenged our ideas about tropical fires. Note that there are no confirmed tropical pyroCbs, globally. | |
| Near IR | 2.2 micron Near IR, showing direct glow from fire. | |
| Fire IR | 3.9 micron "Fire" IR band. This shows the fire's emissions more clearly, but also shows a lot of scatetr from the plume, as well as hot ground. | |
| Upper-level WV | Upper-level water vapour imagery. With 2.2 micron imagery ghosted in for orientation. | |
| Mid-level WV | Mid-level water vapour imagery. Look for interactions with the plume. With 2.2 micron imagery ghosted in for orientation. | |
| Lower-level WV | Lower-level water vapour imagery. Look for interactions with the plume ("Bow Wave"). With 2.2 micron imagery ghosted in for orientation. | |
| Real colour | Real-colour RGB imagery. | |
| Red | Red only. | |
20180117 | 17th January, 2018. A wildfire starts near the Newell Highway in the Pilliga. The fire runs to the west under somewhat anomalous winds. This is a neat case study of tracking a fire in different bands. See the next block for the next day, below. | |
| Red | Red only (RGB feed not working at the time). | |
| 2.2µm Near Infra-red | Shows the fire's glow in white. | |
| 3.9µm Near Infra-red | Shows the fire's glow in yellow-red-white. Note that hot grasslands show in the same colours. | |
| High level water vapour | Shows the convective environment above the fire. | |
| Mid level water vapour | Shows the convective environment above the fire. | |
| Low level water vapour | Shows the convective environment above the fire. | |
| Thermal Infra-red | Shows the fire's spread in black, and the plume in grey. | |
20180118 | 18th January, 2018. Containment effort on the wildfire in the Pilliga. Crews burn-off from fire trails to the west, then to the north - extending over 30km. Note the passage of high-level cloud bands. See the previous block for the previous day's initial run, below. | |
| Red | Red only (RGB feed not working at the time). | |
| 2.2µm Near Infra-red | Shows the fire's glow in white. | |
| 3.9µm Near Infra-red | Shows the fire's glow in yellow-red-white. Note that hot grasslands show in the same colours. | |
| High level water vapour | Shows the convective environment above the fire. | |
| Mid level water vapour | Shows the convective environment above the fire. | |
| Low level water vapour | Shows the convective environment above the fire. | |
| Thermal Infra-red | Shows the fire's spread in black, and the plume in grey. | |
20171026 RGB Near Infrared 3.9 micron fire band High level water vapour Mid level water vapour Low level water vapour Thermal Infrared | 26th October, 2017. A deep low pressure cell moved eastwards ove rthe Riverina. A large band of thunderstorms preceded it. Within the system are seen (a) organised outflow winds from storm cells near Albury, (b) a stationary set of glory clouds well offshore from Newcastle and (c) a dust storm brews up near Cobar as a troughline passes overhead. | |
20170704 RGB | 4th July, 2017. A set of "Morning Glory" roll clouds are reported in the media as passing over Moree. The band evolves as it moves towards Brisbane. Note the decay of the valley fog in the eastern fall of the Great Divide. It is possible that these events and related undular bores might provide enough additional instability to cause fire blow-up events. | |
20170212 RGB Red only Infrared 3.9µ Low-level WV Some zoomed-out sequences: RGB Low-level WV Mid-level WV High-level WV | 12th February, 2017. On a day of elevated fire danger, the Sir Ivan Fire escalates and then develops a blow-up fire event which forms a pulsed pyroCb. The blow-up happened as the air pressure reached its minimum on the troughline, which is seen travelling from SW to NE. Ahead of it there are widespread Cu clouds, while the sky is clear behind. The pyroCb forms on that edge. The water vapour imagery shows a persistent "bow wave" formed by the fire's plume acting against ambient air flow. It forms much earlier than the blow-up. The blow-up event was predicted, and this is the first operationally predicted pyroCb. To the south is the White Cedars Fire, and other large fires are towards the right of the images. | |
20160515 | 15th May, 2016. A persistent west-east high pressure ridge created a zonal wind flow. In passing over the Great Divide, this caused a pronounced foehn effect and a series of gravity waves. The low-level water vapour imagery showed these clearly. | |
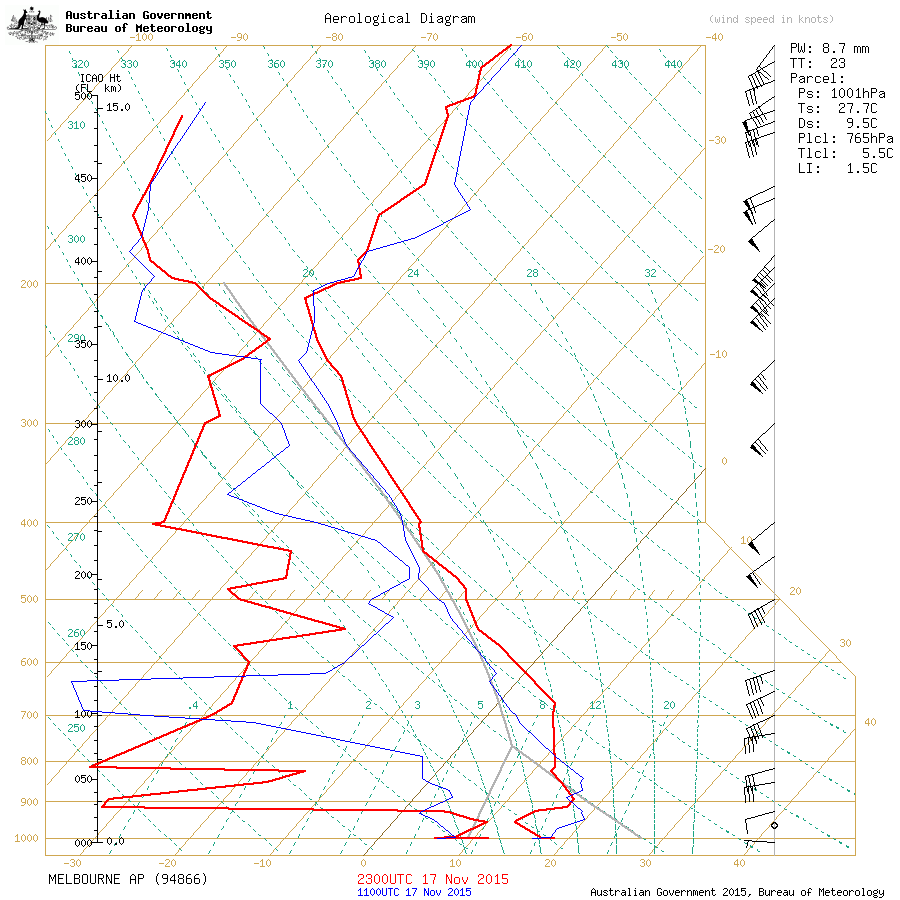
20151118 | 18th Nov 2015: An animation of the progression of smoke from the previous Esperance Fires (17 Nov) across southeast Australia. This uses the green band only, as this gave the best contrast for the smoke. The smoke lies between low-level strato-cumulus and capping fracto-cumulus. Note the time of travel between Melbourne and Canberra and the shadows in the last frame, just before sunset. Click here for an aerological diagram for that. | |
|
20151125: 3.9µ and red
00 UTC to 01 UTC 01 UTC to 02 UTC 02 UTC to 03 UTC 03 UTC to 04 UTC 04 UTC to 05 UTC 05 UTC to 06 UTC 06 UTC to 07 UTC A basemap [SSEC] | 25th Nov 2015: Multiple band views of the catastrophic Pinery Fire north of Adelaide, SA.
We can see a fire running fast ahead of a cold front, then tuning left inland. Note that cloud sporadically blocks the IR signal coming from the surface. These images have been fast tracked, and are animated GIFs only. | |
20151117 RGB visible composite B08 - NIR (2.3 micron) [thanks to Dan Lindsey for this use] B09 - Fire (3.9 micron) B09 - High level WV B10 - Low level WV B16 - Thermal IR All of the above | 17th Nov 2015: Multiple band vuews of the catastrophic fires near Esperance, WA.
We can see a fire running 100km, a cold front hitting the fires, multiple gravity waves, offshore lateral smoke transport and more. | |
20151009 RGB visible composite B08 - Upper WV B09 - Mid WV B10 - Low WV B13 - Thermal IR | 9th Oct 2015: WV, Thermal IR and RGB composite of an orographically affected westerly flow forming late thunderstorms over the ACT. | |
20151107 | 7th Nov 2015: A merged animation of visible and upper-level water vapour showing a Cb forming next to a dry slot over the Wollombi Valley behind Newcastle. | |
20151101 | 1st Nov 2015: Low-level WV, Thermal IR and RGB composite of a vigorous trough over SE Australia, with a Cb anvil bigger than Tasmania. | |
20151007 | 7th Oct 2015: On a day with a number of fires in NE NSW, a complex cold front pushes up the coast with a large dry slot inland. Ends with some imagery of the Lancefield (Vic) Fire on the 6th(Large MP4 file.) | |
20150909 | 9th Sep 2015: A demonstration of the resolving capability of H-8 of a fireground. This is a large HRB in Queensland. | |
![A basemap [SSEC]](pinery_base.png)