[Posters]
| General learning outcome: | GENERAL WEATHER: | Specific learning outcome: | Vertical air flow and the vertical structure of the atmosphere are important for escalated fire. | Topic: | Obtaining and interpreting an Aerological Diagram. |
Operational Awareness for Advanced Firefighters & Fire Behaviour Analysts
Aerological Diagrams are useful way of plotting the data obtained from weather balloon flights. These are very detailed and not intuitive. Behind training, these are the most valuable tool for fire managers and analysts. They should be analysed by Situation Unit staff. Operations Unit senior officers benefit from a familiarity with them. They are posted on the web by a number of services, including BoM.

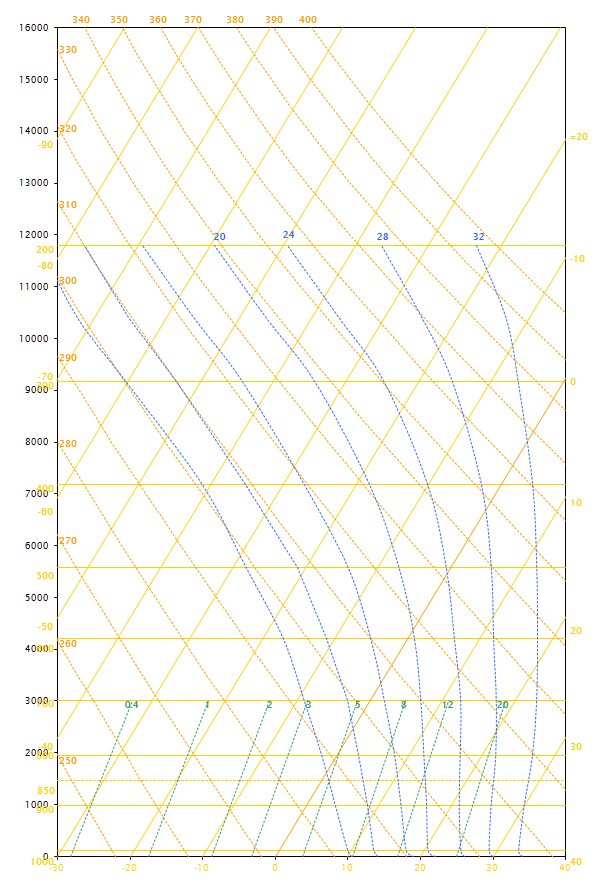
A blank Aerological Diagram. Many properties of the atmosphere vary in a strongly intertwined manned as altitude changes. Altitude and pressure are broadly equivalent. Temeprature lines (yellow) are skewed to the top-right to keep a typical profile on the page. Rising air would follow a "dry adiabat" as it rises (orange lines) or a "saturated adiabat" if it was saturated (blue lines). The green lines show the absolute quantity of mositure in the air, the mixing ratio.
.